Hi everyone, Today I want to talk about Bitcoin's Road Map 🗺️.
First, I have to say sorry for the busy chart, but I suggest to you please spend some minutes on this post, probably useful (This is just my idea).
Bitcoin Analyze ( BTCUSDT ) Timeframe 12h⏰
Location🌊: Bitcoin's Correction has started at around 64200$. Bitcoin was able to pass the First Main wave of Correction (Main wave A) at 28805$. Wave A had 3 microwaves, so we have to wait for seeing Flat or Triangle Correction, although, When Bitcoin penetrated over 64,000 last month, the triangle will not happen. so, we have to wait for a Flat correction (3-3-5).
Already, Bitcoin passed Main wave B at 69000$ and now, bitcoin has started the Main wave C. if you look at carefully to end of main wave B, you can see that Main wave B has ended exactly 105% of the Main wave A, As a result, I expect that Bitcoin is running on Running Flat Correction (I put a sample of this structure in my chart).
where is Bitcoin now?
Bitcoin is moving in expanding triangle which is making microwave 5 of microwave 1 of Main wave C. The end of microwave 5 of microwave 1 of Main wave C can be around 50830$ = 38.2% Fibonacci Level of BTC Logarithmic Curve Zones Indicator + 61.8% microwave c of Main wave B + 38.2% Main wave B +Pivot Major
❗️Note❗️: if Bitcoin can break the upper line of Expanding Triangl microwave 5 of microwave 1 of the Main wave C = Counting waves will change for the short term.
🔴According to my last post about Bitcoin, I am believing that Bitcoin will touch 38.2% Fibonacci Level of BTC Logarithmic Curve Zones Indicator. 👇

🔴RSI Analyze: RSI is moving on descending channel + we watched one of the valid bearish signals for RSI === Bearish Failure Swing, I believe that bitcoin will enter the oversold zone.👇
🔴Bitcoin CME Futures❗️: These counting waves can fill Gap of the CME Futures chart. what is your idea? just 2 gaps haven't been filled on bitcoin history.👇
🔴November candlestick pattern: we can find 💫Shooting Star💫Pattern (Bearish) =Under 53000$, the trigger will activate.👇
Thanks for reading this post, I hope that is useful for all.🌹🙏
Do not forget to put Stop loss for your positions (For every position you want to open).
Please follow your strategy, this is just my idea, and I will be glad to see your ideas in this post.
Please do not forget the ✅'like'✅ button 🙏😊 & Share it with your friends, Thanks, and Trade safe
ความคิดเห็น:
I meant Regular flat 😊😂
ความคิดเห็น:
Crypto Total Market Cap $❗️
Concentrate on Heavy Zones.
Crypto Total Market Cap $❗️
Concentrate on Heavy Zones.
ความคิดเห็น:
New Post: Bitcoin Analyze (Expanding Diagonal)!!!📣

New Post: Bitcoin Analyze (Expanding Diagonal)!!!📣
ความคิดเห็น:
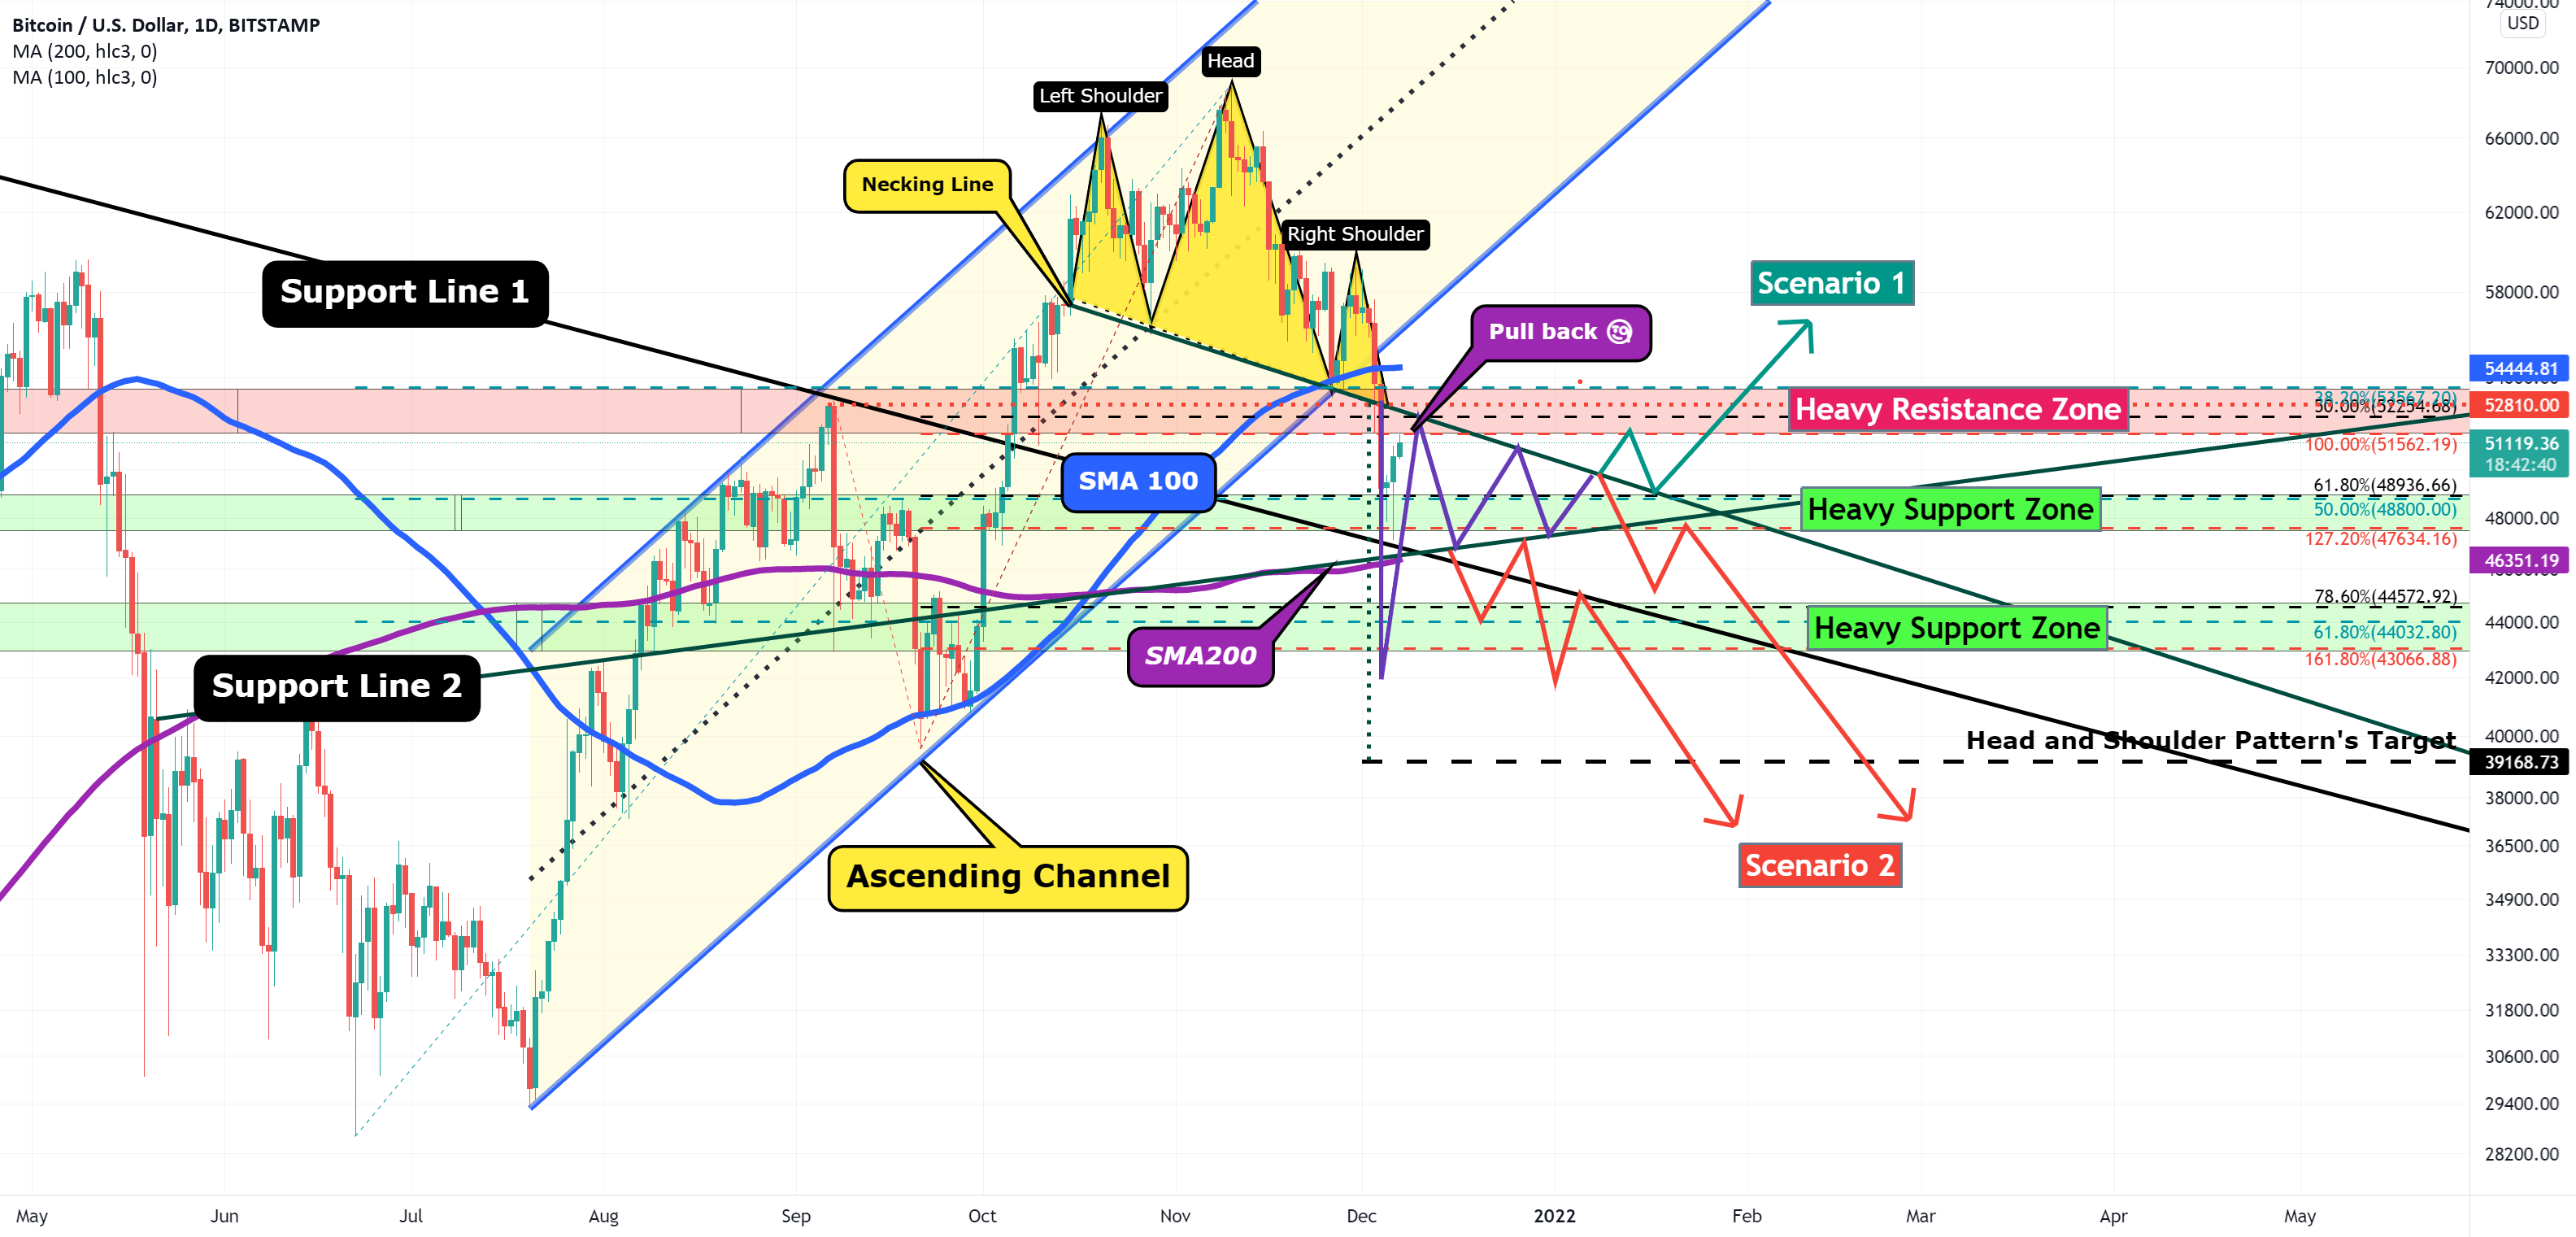
Bitcoin Analyze❗️
Head and Shoulder 🧐❗️The right shoulder will be complete ❓❗️
Bitcoin Analyze❗️
Head and Shoulder 🧐❗️The right shoulder will be complete ❓❗️
ความคิดเห็น:
BTC is running as i expected
ความคิดเห็น:
New Post

ความคิดเห็น:
New Post
ความคิดเห็น:
New post

ความคิดเห็น:
Remember