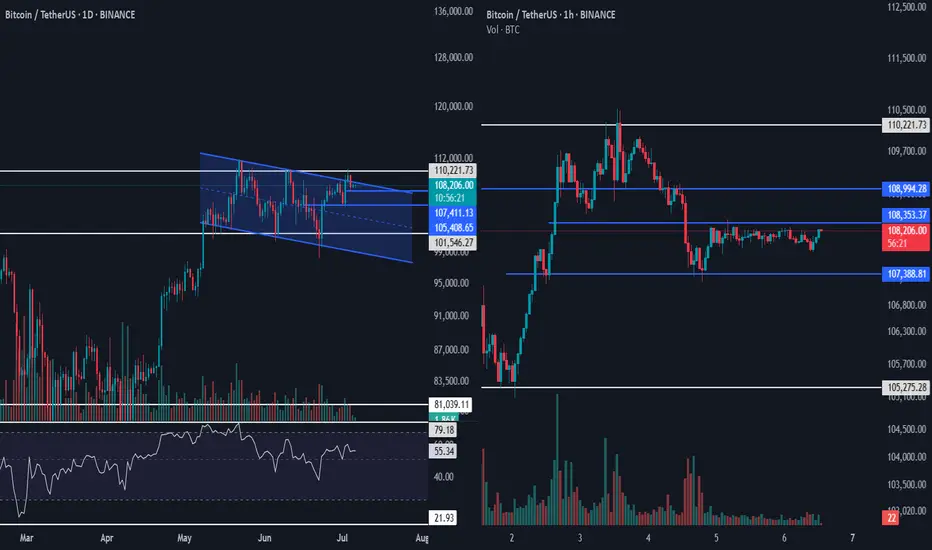
On the right side of the image, we have the daily chart of BTC, and on the left, the 1-hour chart. Let’s first break down the current price action in the daily timeframe:
📉 Daily Timeframe (BTCUSDT)
We can currently interpret the market in two ways:
As part of a descending channel
Or as a range-bound movement between $110,221.73 (resistance) and $101,546.27 (support)
If we consider the descending channel, it’s important to note that the upper trendline has not been broken yet. If price fails to decisively move above $110,221.73 by tomorrow—or worse, gives a fake breakout and rejects—this would confirm a channel rejection, and we could expect price to move back toward the midline or even the lower boundary of the channel.
📌 Keep in mind: The broader trend is still bullish, but this analysis focuses on the current short-term structure.
🔹 Long trigger: A confirmed breakout above $110,221.73
🔻 Short trigger: A breakdown below $105,408.65
🕐 1-Hour Timeframe (BTCUSDT)
The 1H chart allows for more precise and early entries, from both directions.
A short-term profit target could be set around $108,353.37, assuming price moves up.
However, before that, we need to watch for a failure swing or fakeout near $107,388.81 — this is crucial for determining the validity of any bullish setups.
📌 We need confirmation that buyers are still active before entering longs.
For short positions:
Since price already rejected from $110,221.73 and is now consolidating in a range, a valid short trigger could also be $107,388.81, especially if we see a minor rally and failure to break above it.
For better risk/reward, it would be ideal to see price bounce slightly above the support, then form a lower high below $108,353.37, giving us a tighter stop-loss and potentially RR > 2.
🧠 Important Note: Since shorting goes against the overall bullish trend, any short positions should be taken with reduced risk, tighter stops, and strict risk management.
#Bitcoin #BTCUSDT #CryptoTrading #TechnicalAnalysis #TradingView #BTCAnalysis #CryptoStrategy #CryptoTA #PriceAction
คำจำกัดสิทธิ์ความรับผิดชอบ
ข้อมูลและบทความไม่ได้มีวัตถุประสงค์เพื่อก่อให้เกิดกิจกรรมทางการเงิน, การลงทุน, การซื้อขาย, ข้อเสนอแนะ หรือคำแนะนำประเภทอื่น ๆ ที่ให้หรือรับรองโดย TradingView อ่านเพิ่มเติมใน ข้อกำหนดการใช้งาน
คำจำกัดสิทธิ์ความรับผิดชอบ
ข้อมูลและบทความไม่ได้มีวัตถุประสงค์เพื่อก่อให้เกิดกิจกรรมทางการเงิน, การลงทุน, การซื้อขาย, ข้อเสนอแนะ หรือคำแนะนำประเภทอื่น ๆ ที่ให้หรือรับรองโดย TradingView อ่านเพิ่มเติมใน ข้อกำหนดการใช้งาน