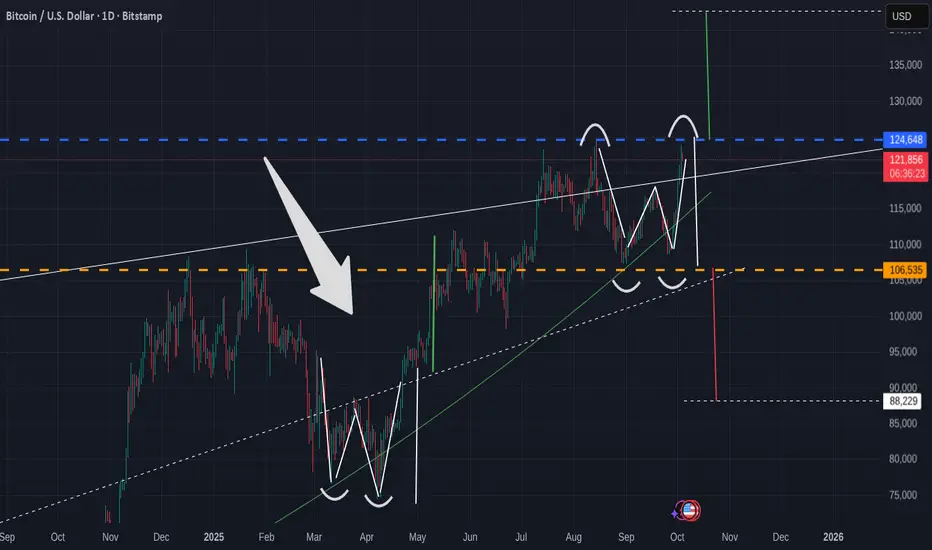
A Very simple Bitcoin Daily chart
Obviously, the eye is drwan to the Arrow pointing towards March / April 2025 when Bitcoin PA printed a W patter, or a double bottom.
The Vertical lines show the measured move higher that was executed perfectly.
The question we have right now is, have we just printed another W pattern, with a Measured Move higher to 142K usd
Or Have we just printed a Double TOP with a measured move LOWER to around 88K usd
4 days ago I posted the Monthly Charts and mentioned that we may start October with a Drop, that may last till around 12 - 15 October.
Untill this measured move plays out, I stand by this But I am obviously also open to this not happening.
What ever happens, I have learnt over the years to be ready for BOTH sides of the coin.
I DO have a BUY SPOT order placed for Bitcoin at 92K
IF we get down there,,IF,,,,,It may well be thelast time we get the chance to Buy Bitcoin under 100K
Time will tell
Nothing to be taken as Financial advice.
I will always say
"Only invest what you can afford to loose. When you are ready, take out your original investment. This way, it is only your profit that is at risk"
THAT is Financial advice
I will always say
"Only invest what you can afford to loose. When you are ready, take out your original investment. This way, it is only your profit that is at risk"
THAT is Financial advice
คำจำกัดสิทธิ์ความรับผิดชอบ
ข้อมูลและบทความไม่ได้มีวัตถุประสงค์เพื่อก่อให้เกิดกิจกรรมทางการเงิน, การลงทุน, การซื้อขาย, ข้อเสนอแนะ หรือคำแนะนำประเภทอื่น ๆ ที่ให้หรือรับรองโดย TradingView อ่านเพิ่มเติมใน ข้อกำหนดการใช้งาน