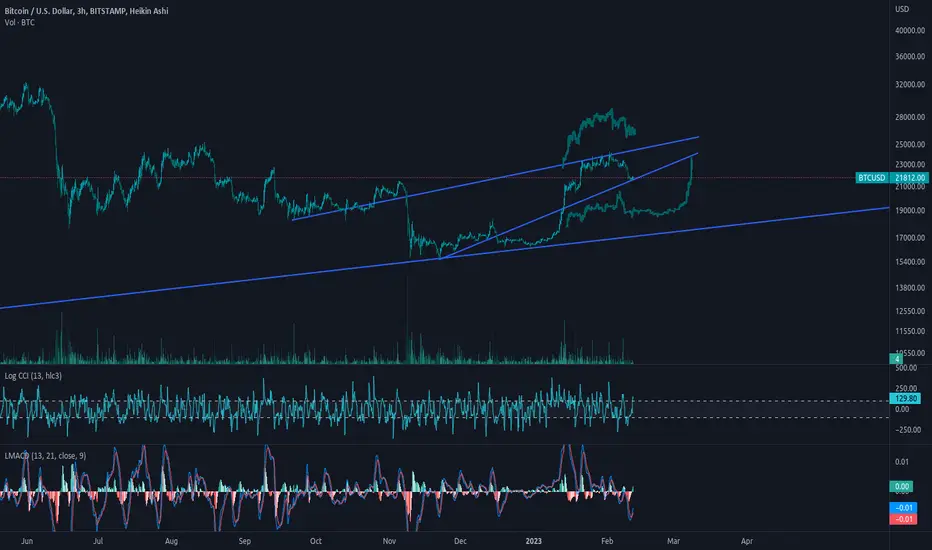
Bitcoin has formed what I like to call a wyckoff mound. Bars pattern fractal below is from the recent november 21 lows and shows a potential as to what direction btc may be going next. The above bars pattern fractal is from 7/20/21 ( scaled down in size ) coming out of its may correction and sell off. The Log CCI a leading indicator has already pushed towards the top and the Log Macd being a lagging indicator is following upwards after on its recent sell off. It appears as if and looks to be coiling up for another break out stair climb up to make a new price floor level. 3 hour timeframe. Bottom line is a macro line from previous december 2018 bottom and march 2020 crash to recent.
คำจำกัดสิทธิ์ความรับผิดชอบ
ข้อมูลและบทความไม่ได้มีวัตถุประสงค์เพื่อก่อให้เกิดกิจกรรมทางการเงิน, การลงทุน, การซื้อขาย, ข้อเสนอแนะ หรือคำแนะนำประเภทอื่น ๆ ที่ให้หรือรับรองโดย TradingView อ่านเพิ่มเติมใน ข้อกำหนดการใช้งาน
คำจำกัดสิทธิ์ความรับผิดชอบ
ข้อมูลและบทความไม่ได้มีวัตถุประสงค์เพื่อก่อให้เกิดกิจกรรมทางการเงิน, การลงทุน, การซื้อขาย, ข้อเสนอแนะ หรือคำแนะนำประเภทอื่น ๆ ที่ให้หรือรับรองโดย TradingView อ่านเพิ่มเติมใน ข้อกำหนดการใช้งาน