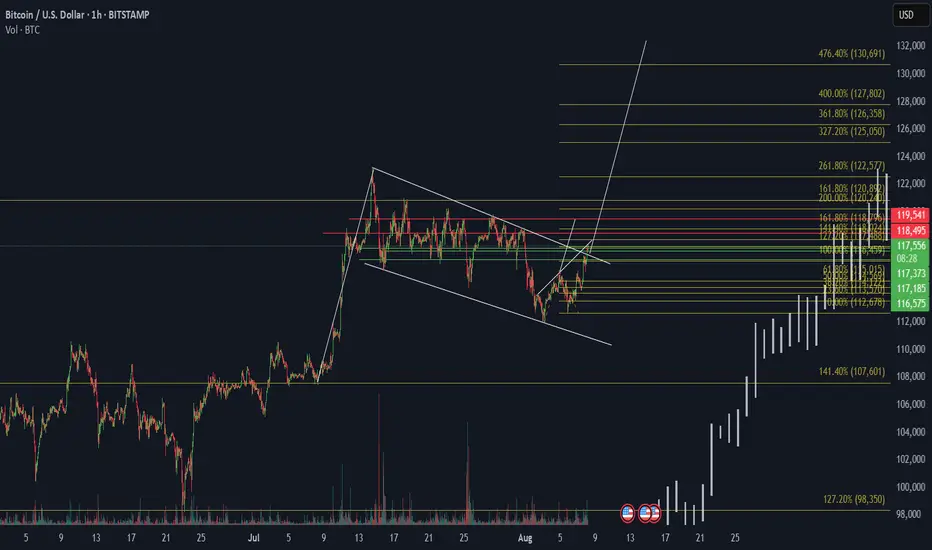
Technical Highlights:
Pattern Breakout: BTC has broken out of a descending wedge, a bullish reversal pattern.
Fibonacci Extensions: The price projection levels are drawn from the recent swing low to high:
1.618 (161.8%) 120,892
2.618 (261.8%) 122,577
3.618 (361.8%) 126,358
4.764 (476.4%) 130,691 = Target Area
Volume: A noticeable volume spike supports the breakout.
Current Price: Around 117,225 reclaiming above key resistance levels.
Bullish Confirmation Levels:
117,373 (Previous resistance now acting as support)
118,495 and 119,541 Strong horizontal resistance to clear
Sustained close above 120K could lead to a parabolic move toward 130K+
คำจำกัดสิทธิ์ความรับผิดชอบ
ข้อมูลและบทความไม่ได้มีวัตถุประสงค์เพื่อก่อให้เกิดกิจกรรมทางการเงิน, การลงทุน, การซื้อขาย, ข้อเสนอแนะ หรือคำแนะนำประเภทอื่น ๆ ที่ให้หรือรับรองโดย TradingView อ่านเพิ่มเติมที่ ข้อกำหนดการใช้งาน
คำจำกัดสิทธิ์ความรับผิดชอบ
ข้อมูลและบทความไม่ได้มีวัตถุประสงค์เพื่อก่อให้เกิดกิจกรรมทางการเงิน, การลงทุน, การซื้อขาย, ข้อเสนอแนะ หรือคำแนะนำประเภทอื่น ๆ ที่ให้หรือรับรองโดย TradingView อ่านเพิ่มเติมที่ ข้อกำหนดการใช้งาน