Title:
Catch Trends Early with Parabolic SAR + QMA Combo! 🚀 (BTC/USD Example)
⸻
Here’s a simple but powerful trend-following strategy I personally use — combining Parabolic SAR with Quantum Moving Average (QMA).
Works great on Bitcoin, Gold, Nifty, and other trending assets.
⸻
How it Works:
1. Identify the Trend:
• When price is below QMA and Parabolic SAR dots are above price → strong downtrend
• When price is above QMA and Parabolic SAR dots are below price → strong uptrend
2. Confirm Entry After Reversal:
• Wait for price to close above QMA and SAR dots flip below price for a long setup
• Wait for price to close below QMA and SAR dots flip above price for a short setup
⸻
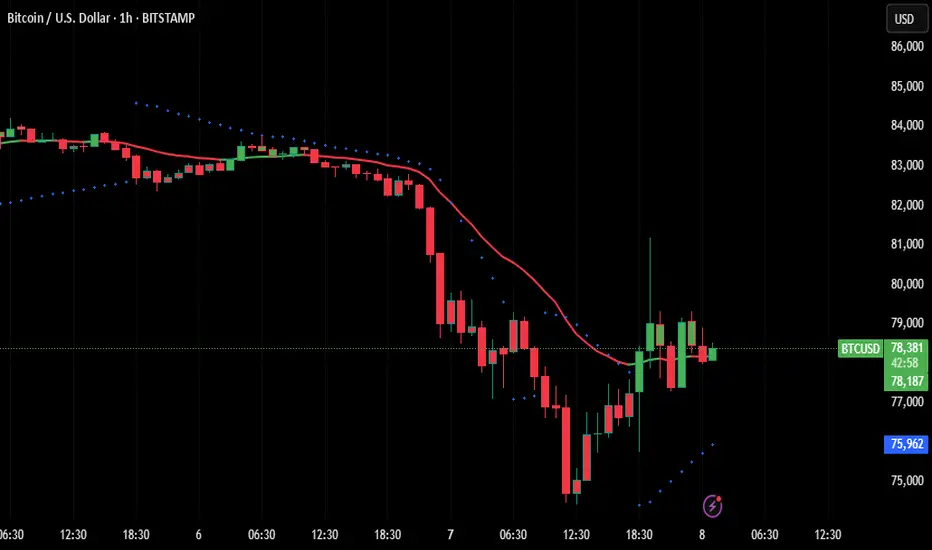
Real Example (BTC/USD 1H Chart):
• After a heavy downtrend, price broke above QMA and Parabolic SAR flipped below.
• This suggests a possible early trend reversal toward the upside.
If the setup holds, BTC could move back toward higher fib levels or supply zones.
⸻
Why I Love This Combo:
• Easy visual confirmation (SAR dots + moving average)
• Works well on 1H and 4H charts for swing trading
• Filters out false breakouts and sideways chop
⸻
Backtest this simple combo on your favorite assets and see the magic!
⸻
Found this helpful? Tap LIKE ❤ & FOLLOW ➕ for more strategies shared weekly!
⸻
#BTCUSD #Bitcoin #ParabolicSAR #TrendFollowing #TradingStrategy #QMA #TechnicalAnalysis #PriceAction #ForexStrategy #CryptoTrading
Catch Trends Early with Parabolic SAR + QMA Combo! 🚀 (BTC/USD Example)
⸻
Here’s a simple but powerful trend-following strategy I personally use — combining Parabolic SAR with Quantum Moving Average (QMA).
Works great on Bitcoin, Gold, Nifty, and other trending assets.
⸻
How it Works:
1. Identify the Trend:
• When price is below QMA and Parabolic SAR dots are above price → strong downtrend
• When price is above QMA and Parabolic SAR dots are below price → strong uptrend
2. Confirm Entry After Reversal:
• Wait for price to close above QMA and SAR dots flip below price for a long setup
• Wait for price to close below QMA and SAR dots flip above price for a short setup
⸻
Real Example (BTC/USD 1H Chart):
• After a heavy downtrend, price broke above QMA and Parabolic SAR flipped below.
• This suggests a possible early trend reversal toward the upside.
If the setup holds, BTC could move back toward higher fib levels or supply zones.
⸻
Why I Love This Combo:
• Easy visual confirmation (SAR dots + moving average)
• Works well on 1H and 4H charts for swing trading
• Filters out false breakouts and sideways chop
⸻
Backtest this simple combo on your favorite assets and see the magic!
⸻
Found this helpful? Tap LIKE ❤ & FOLLOW ➕ for more strategies shared weekly!
⸻
#BTCUSD #Bitcoin #ParabolicSAR #TrendFollowing #TradingStrategy #QMA #TechnicalAnalysis #PriceAction #ForexStrategy #CryptoTrading
คำจำกัดสิทธิ์ความรับผิดชอบ
ข้อมูลและบทความไม่ได้มีวัตถุประสงค์เพื่อก่อให้เกิดกิจกรรมทางการเงิน, การลงทุน, การซื้อขาย, ข้อเสนอแนะ หรือคำแนะนำประเภทอื่น ๆ ที่ให้หรือรับรองโดย TradingView อ่านเพิ่มเติมที่ ข้อกำหนดการใช้งาน
คำจำกัดสิทธิ์ความรับผิดชอบ
ข้อมูลและบทความไม่ได้มีวัตถุประสงค์เพื่อก่อให้เกิดกิจกรรมทางการเงิน, การลงทุน, การซื้อขาย, ข้อเสนอแนะ หรือคำแนะนำประเภทอื่น ๆ ที่ให้หรือรับรองโดย TradingView อ่านเพิ่มเติมที่ ข้อกำหนดการใช้งาน