Recent analysis of Bitcoin's price chart points towards a sustained bearish momentum, with key technical indicators reinforcing a cautious outlook for the cryptocurrency. The most prominent signal is the formation of a consistent pattern of lower lows. This sequential decline, where each significant price trough dips below the previous one, is a classic and reliable confirmation of a downtrend. It demonstrates that sellers are in firm control, successfully pushing the price to new local bottoms with each successive wave of selling pressure.
Adding significant weight to this bearish structure is the emergence of bearish engulfing candlestick patterns on the chart. These patterns are particularly telling; they occur when a large red candle completely "engulfs" the body of the preceding green candle. This signifies a powerful shift in momentum within a single trading session, where early buying optimism is completely overwhelmed by aggressive selling activity by the session's close. The presence of these candles at resistance levels or during minor recovery attempts often signals that any bullish rallies are being used as opportunities for sellers to enter new short positions, effectively trapping optimistic buyers.
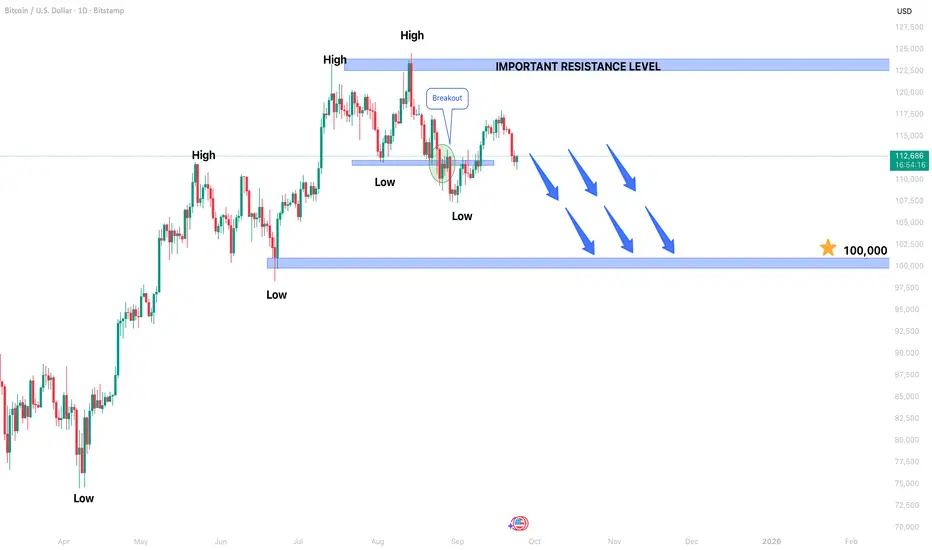
Given the confluence of these technical factors—the established pattern of lower lows and the confirmation from bearish engulfing candles—the expectation is for the market to remain under selling pressure in the upcoming trading sessions. The path of least resistance appears to be downward. Consequently, analysts are setting their sights on a major support target on the lower side, around the $100,000 psychological level. A test of this zone seems increasingly probable if the current bearish momentum persists.
On the flip side, any attempt at a recovery will face a formidable barrier. The $124,500 level is now identified as a critical resistance point. For the current bearish thesis to be invalidated, Bitcoin would need to achieve a decisive and sustained break above this ceiling. Until then, this level will likely act as a cap on any upward movements, reinforcing the prevailing negative sentiment and defining the upper boundary of the current bearish trend.
Adding significant weight to this bearish structure is the emergence of bearish engulfing candlestick patterns on the chart. These patterns are particularly telling; they occur when a large red candle completely "engulfs" the body of the preceding green candle. This signifies a powerful shift in momentum within a single trading session, where early buying optimism is completely overwhelmed by aggressive selling activity by the session's close. The presence of these candles at resistance levels or during minor recovery attempts often signals that any bullish rallies are being used as opportunities for sellers to enter new short positions, effectively trapping optimistic buyers.
Given the confluence of these technical factors—the established pattern of lower lows and the confirmation from bearish engulfing candles—the expectation is for the market to remain under selling pressure in the upcoming trading sessions. The path of least resistance appears to be downward. Consequently, analysts are setting their sights on a major support target on the lower side, around the $100,000 psychological level. A test of this zone seems increasingly probable if the current bearish momentum persists.
On the flip side, any attempt at a recovery will face a formidable barrier. The $124,500 level is now identified as a critical resistance point. For the current bearish thesis to be invalidated, Bitcoin would need to achieve a decisive and sustained break above this ceiling. Until then, this level will likely act as a cap on any upward movements, reinforcing the prevailing negative sentiment and defining the upper boundary of the current bearish trend.
คำจำกัดสิทธิ์ความรับผิดชอบ
ข้อมูลและบทความไม่ได้มีวัตถุประสงค์เพื่อก่อให้เกิดกิจกรรมทางการเงิน, การลงทุน, การซื้อขาย, ข้อเสนอแนะ หรือคำแนะนำประเภทอื่น ๆ ที่ให้หรือรับรองโดย TradingView อ่านเพิ่มเติมที่ ข้อกำหนดการใช้งาน
คำจำกัดสิทธิ์ความรับผิดชอบ
ข้อมูลและบทความไม่ได้มีวัตถุประสงค์เพื่อก่อให้เกิดกิจกรรมทางการเงิน, การลงทุน, การซื้อขาย, ข้อเสนอแนะ หรือคำแนะนำประเภทอื่น ๆ ที่ให้หรือรับรองโดย TradingView อ่านเพิ่มเติมที่ ข้อกำหนดการใช้งาน