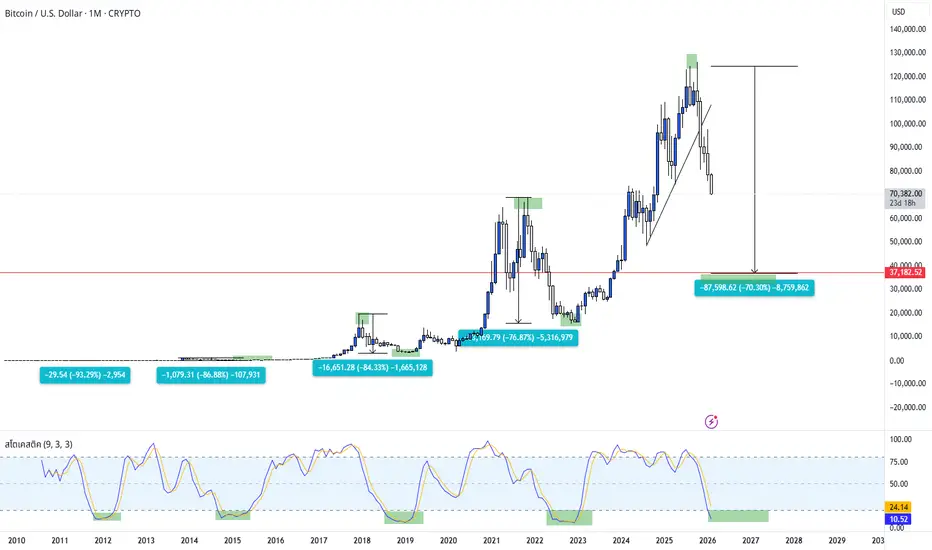
Overview The image displays a monthly timeframe chart of Bitcoin against the U.S. Dollar (BTC/USD) on TradingView. The analysis focuses on historical market cycles, specifically measuring the percentage of drawdowns (price declines) from All-Time Highs to cycle bottoms.
Key Technical Observations:
1. Historical Drawdowns: The chart highlights previous bear market corrections with blue labels, showing significant drops:
~93% drop in 2011.
~86% drop in the 2013–2015 cycle.
~84% drop in the 2017–2018 cycle.
~76% drop in the 2021–2022 cycle.
2. Current Price Structure & Projection:
The chart shows a recent peak well above the $100,000 mark.
There is a projection measurement tool indicating a potential decline of -70.30% from the peak.
This projection targets a specific support level marked by a red horizontal line at $37,182.52.
3. Stochastic Oscillator (9, 3, 3):
Located at the bottom panel, the Stochastic indicator is currently trending downward.
The indicator lines are approaching the lower "oversold" zone (green shaded area). Historically, as shown in previous cycles (2015, 2018, 2022), when the Stochastic reaches this bottom zone, it often coincides with the market finding a long-term price floor.
Conclusion: The chart suggests a bearish cycle analysis, comparing the current market correction to historical crash patterns. It implies that if the price follows a ~70% correction pattern, the major support to watch is around the $37,000 region, coinciding with the Stochastic indicator reaching oversold levels.
คำจำกัดสิทธิ์ความรับผิดชอบ
ข้อมูลและบทความไม่ได้มีวัตถุประสงค์เพื่อก่อให้เกิดกิจกรรมทางการเงิน, การลงทุน, การซื้อขาย, ข้อเสนอแนะ หรือคำแนะนำประเภทอื่น ๆ ที่ให้หรือรับรองโดย TradingView อ่านเพิ่มเติมใน ข้อกำหนดการใช้งาน
คำจำกัดสิทธิ์ความรับผิดชอบ
ข้อมูลและบทความไม่ได้มีวัตถุประสงค์เพื่อก่อให้เกิดกิจกรรมทางการเงิน, การลงทุน, การซื้อขาย, ข้อเสนอแนะ หรือคำแนะนำประเภทอื่น ๆ ที่ให้หรือรับรองโดย TradingView อ่านเพิ่มเติมใน ข้อกำหนดการใช้งาน