What is AutoFibGauge? How to Trade Using Automatic Fibonacci Zones! 🎯
⸻
Manually drawing Fibonacci retracements can be confusing and time-consuming.
That’s why I use AutoFibGauge, a custom tool that automatically detects swing highs and lows and plots key Fibonacci levels for you.
It makes my trading faster, more accurate, and helps avoid emotional errors.
⸻
What is Fibonacci Retracement?
Fibonacci retracement is based on the idea that markets tend to retrace a predictable portion of a move before continuing in the original direction.
The most important Fibonacci levels are:
• 23.6% – Minor pullback
• 38.2% – Healthy correction
• 50.0% – Psychological midpoint
• 61.8% – Golden zone (high probability bounce/reversal area)
• 78.6% – Deep correction zone
Traders use these levels to spot potential support and resistance zones.
⸻
What AutoFibGauge Does:
• Automatically finds recent swing points
• Plots Fibonacci retracement levels instantly
• Highlights important reaction zones like 38.2%, 50%, 61.8%
• Updates dynamically as the market evolves
⸻
How I Use It:
1. Identify if price is reacting to key Fib levels (like 0.382 or 0.618)
2. Combine with trend confirmation (like QMA or Parabolic SAR)
3. Plan entries, exits, and stop-loss around these Fib zones
This saves time and removes the guesswork!
⸻
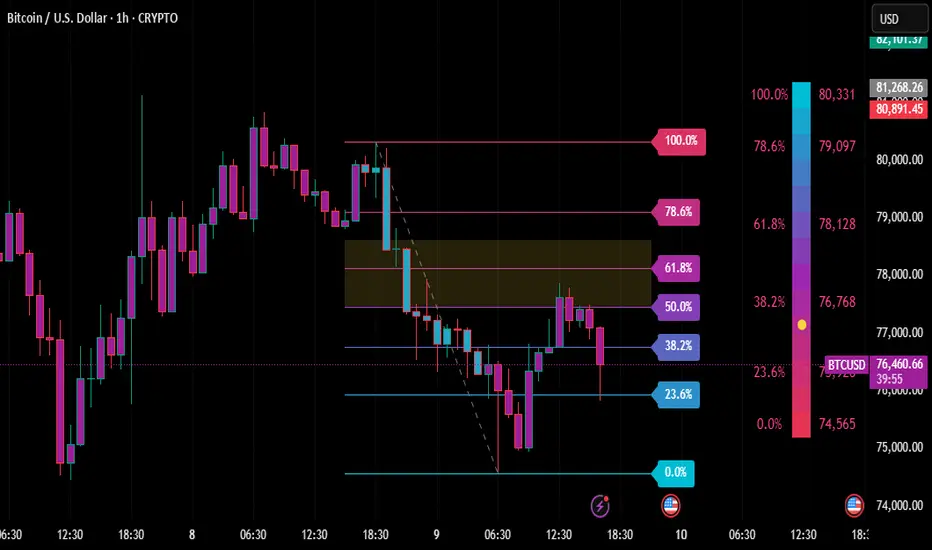
Real Example (BTC/USD 1H Chart):
• After a strong fall, AutoFibGauge plotted the Fibonacci zones automatically.
• Price reacted perfectly near the 61.8% and 78.6% retracement areas.
• These zones act as high-probability reversal or continuation areas.
⸻
I’m using the AutoFibGauge indicator (available free under TechnoBlooms on TradingView).
If you’d like the direct link or help setting it up, feel free to comment below or DM me!
⸻
Tap LIKE ❤ & FOLLOW ➕ if you found this helpful! More trading tools and strategy tips coming soon!
⸻
#BTCUSD #Bitcoin #AutoFibGauge #FibonacciTrading #TechnicalAnalysis #PriceAction #TradingTools #LearnTrading #CryptoTrading #ForexStrategy
⸻
Manually drawing Fibonacci retracements can be confusing and time-consuming.
That’s why I use AutoFibGauge, a custom tool that automatically detects swing highs and lows and plots key Fibonacci levels for you.
It makes my trading faster, more accurate, and helps avoid emotional errors.
⸻
What is Fibonacci Retracement?
Fibonacci retracement is based on the idea that markets tend to retrace a predictable portion of a move before continuing in the original direction.
The most important Fibonacci levels are:
• 23.6% – Minor pullback
• 38.2% – Healthy correction
• 50.0% – Psychological midpoint
• 61.8% – Golden zone (high probability bounce/reversal area)
• 78.6% – Deep correction zone
Traders use these levels to spot potential support and resistance zones.
⸻
What AutoFibGauge Does:
• Automatically finds recent swing points
• Plots Fibonacci retracement levels instantly
• Highlights important reaction zones like 38.2%, 50%, 61.8%
• Updates dynamically as the market evolves
⸻
How I Use It:
1. Identify if price is reacting to key Fib levels (like 0.382 or 0.618)
2. Combine with trend confirmation (like QMA or Parabolic SAR)
3. Plan entries, exits, and stop-loss around these Fib zones
This saves time and removes the guesswork!
⸻
Real Example (BTC/USD 1H Chart):
• After a strong fall, AutoFibGauge plotted the Fibonacci zones automatically.
• Price reacted perfectly near the 61.8% and 78.6% retracement areas.
• These zones act as high-probability reversal or continuation areas.
⸻
I’m using the AutoFibGauge indicator (available free under TechnoBlooms on TradingView).
If you’d like the direct link or help setting it up, feel free to comment below or DM me!
⸻
Tap LIKE ❤ & FOLLOW ➕ if you found this helpful! More trading tools and strategy tips coming soon!
⸻
#BTCUSD #Bitcoin #AutoFibGauge #FibonacciTrading #TechnicalAnalysis #PriceAction #TradingTools #LearnTrading #CryptoTrading #ForexStrategy
บันทึก
Thank you everyone for the great feedback! 🚀Many traders asked for a detailed explanation of how AutoFibGauge settings work and how to customize it for different assets.
I’m preparing a full guide that will be posted soon! Stay tuned and feel free to drop any more questions below!
คำจำกัดสิทธิ์ความรับผิดชอบ
ข้อมูลและบทความไม่ได้มีวัตถุประสงค์เพื่อก่อให้เกิดกิจกรรมทางการเงิน, การลงทุน, การซื้อขาย, ข้อเสนอแนะ หรือคำแนะนำประเภทอื่น ๆ ที่ให้หรือรับรองโดย TradingView อ่านเพิ่มเติมใน ข้อกำหนดการใช้งาน
คำจำกัดสิทธิ์ความรับผิดชอบ
ข้อมูลและบทความไม่ได้มีวัตถุประสงค์เพื่อก่อให้เกิดกิจกรรมทางการเงิน, การลงทุน, การซื้อขาย, ข้อเสนอแนะ หรือคำแนะนำประเภทอื่น ๆ ที่ให้หรือรับรองโดย TradingView อ่านเพิ่มเติมใน ข้อกำหนดการใช้งาน