Main Timeframe — Weekly (Directional Bias)
🔹 Higher Confirmation — Daily
🔹 Trade Setup — 2H
Strong resistance zone
--> Multiple rejections (3 clear touches)
--> Recently formed, clearly visible on the left
--> Obvious reaction area (high-probability zone)
Candlestick context
--> Inside bar at resistance
Confluence
--> 50–61.8% Fibonacci retracement
--> Broken trendline acting as resistance
🔹 Entry Timeframe — 15-Minute
🛑 Risk Management
Stop-loss above:
➡️ Multi-layer protection
🎯 Target
💬 Final Note
If you appreciate clean, rule-based, and well-explained market analysis, feel free to follow.
Your thoughts and alternative perspectives are always welcome in the comments.
⚠️ DISCLAIMER
This analysis is provided for educational purposes only and does not constitute financial advice.
Trading involves risk — always conduct your own analysis.
I am not responsible for any decisions or losses based on this idea.
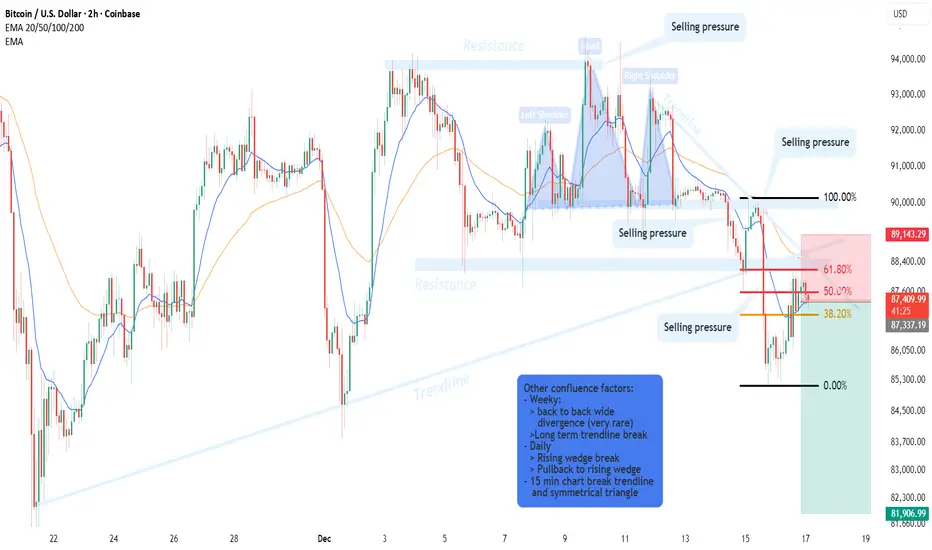
- Back-to-back wide divergence (very rare occurrence)
- Long-term trendline break, shifting market structure
- Provides the primary bearish directional bias
🔹 Higher Confirmation — Daily
- Rising wedge breakdown
- Pullback into the broken wedge structure
- Confirms the Weekly bearish bias
🔹 Trade Setup — 2H
Strong resistance zone
--> Multiple rejections (3 clear touches)
--> Recently formed, clearly visible on the left
--> Obvious reaction area (high-probability zone)
Candlestick context
--> Inside bar at resistance
Confluence
--> 50–61.8% Fibonacci retracement
--> Broken trendline acting as resistance
🔹 Entry Timeframe — 15-Minute
- Trendline break
- Symmetrical triangle breakdown
- Entry only after structure confirmation
🛑 Risk Management
Stop-loss above:
- Resistance zone
- EMA 50
- Fibonacci 61.8%
- Broken trendline
- Descending trendline
➡️ Multi-layer protection
🎯 Target
- Minimum R:R = 1:3
- Justified by full top-down alignment across all timeframes
💬 Final Note
If you appreciate clean, rule-based, and well-explained market analysis, feel free to follow.
Your thoughts and alternative perspectives are always welcome in the comments.
⚠️ DISCLAIMER
This analysis is provided for educational purposes only and does not constitute financial advice.
Trading involves risk — always conduct your own analysis.
I am not responsible for any decisions or losses based on this idea.
การนำเสนอที่เกี่ยวข้อง
คำจำกัดสิทธิ์ความรับผิดชอบ
ข้อมูลและบทความไม่ได้มีวัตถุประสงค์เพื่อก่อให้เกิดกิจกรรมทางการเงิน, การลงทุน, การซื้อขาย, ข้อเสนอแนะ หรือคำแนะนำประเภทอื่น ๆ ที่ให้หรือรับรองโดย TradingView อ่านเพิ่มเติมใน ข้อกำหนดการใช้งาน
การนำเสนอที่เกี่ยวข้อง
คำจำกัดสิทธิ์ความรับผิดชอบ
ข้อมูลและบทความไม่ได้มีวัตถุประสงค์เพื่อก่อให้เกิดกิจกรรมทางการเงิน, การลงทุน, การซื้อขาย, ข้อเสนอแนะ หรือคำแนะนำประเภทอื่น ๆ ที่ให้หรือรับรองโดย TradingView อ่านเพิ่มเติมใน ข้อกำหนดการใช้งาน