TL;DR
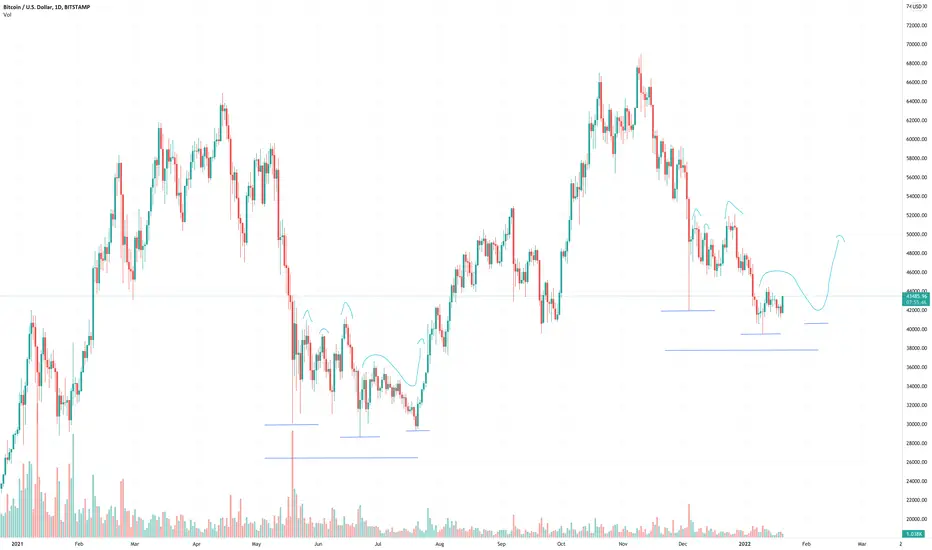
June/July of 2021 and December/January of 2022 have the following notable similarities:
- One big flash dip
- 3 mini peaks followed by a further dip (Bottom)
- Recovery and sideways action before *one final dip somewhere in between both of the lowest wicks*(still to come)
While looking far and wide for some hopium during the latest dip, I decided to check the daily charts from the crash in May/June/July and noticed some similarities between both.
By no means is this truly TA but similarities in both dips may cause them to play out in the same way - if that's the case, the worst is over and I'm anticipating a dip to $40.5k around the 7th-15th of February before a rally.
Will keep an eye on this and update as the days go on.
บันทึก
Lolคำจำกัดสิทธิ์ความรับผิดชอบ
ข้อมูลและบทความไม่ได้มีวัตถุประสงค์เพื่อก่อให้เกิดกิจกรรมทางการเงิน, การลงทุน, การซื้อขาย, ข้อเสนอแนะ หรือคำแนะนำประเภทอื่น ๆ ที่ให้หรือรับรองโดย TradingView อ่านเพิ่มเติมที่ ข้อกำหนดการใช้งาน
คำจำกัดสิทธิ์ความรับผิดชอบ
ข้อมูลและบทความไม่ได้มีวัตถุประสงค์เพื่อก่อให้เกิดกิจกรรมทางการเงิน, การลงทุน, การซื้อขาย, ข้อเสนอแนะ หรือคำแนะนำประเภทอื่น ๆ ที่ให้หรือรับรองโดย TradingView อ่านเพิ่มเติมที่ ข้อกำหนดการใช้งาน