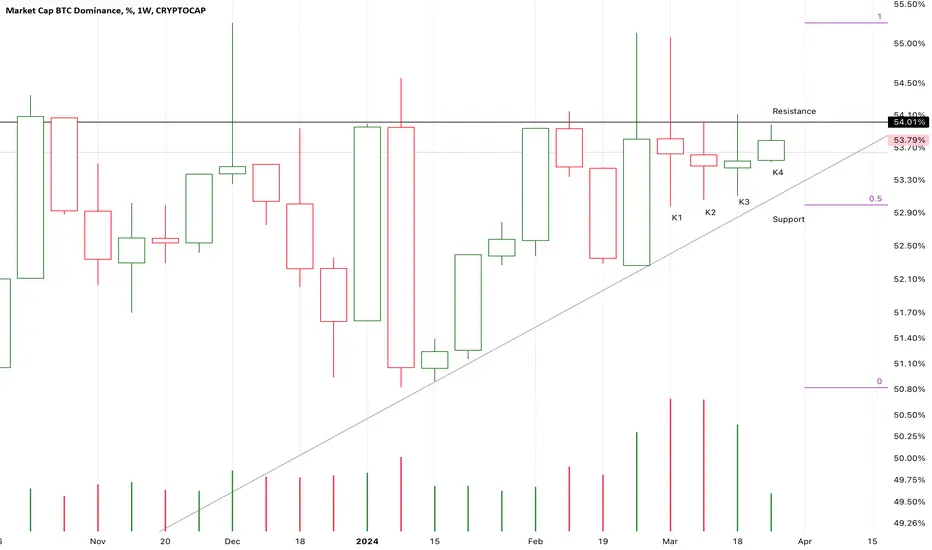
Candles were trapped into a dead corner,
The market will choose a direction to price up or break down.
It seems that the resistance is losing its control here.
It is a potential uptrend triangle pattern.
If K4 close upon the resistance,
It is likely that an upthrust wave will come up,
And, candles will touch 60% area.
บันทึก
In day time chart,
It seems that the following candles will consolidate for days and then test or break up the resistance.
บันทึก
In day time chart,
It seems that K3 will close upon K1 and ended the consolidate process.
บันทึก
Days ago,I was expecting K1 would end the consolidation process,
But unfortunately, I was totally wrong.
If K4 close upon K1 or the resistance,
It is still possible that a sharp upthrust of BTC.D will finally come up.
If K4 failed to break up,
The consolidation process will go on,
And candles will likely test the lower price of K3 for a second time.
If candles finally choose the direction to break up,
It means BTC/USD will absorb bloods from the market,
And other crypto tokens will likely stay or fall.
บันทึก
The doji candle K2 tested the lower price of K1 and failed to close upon K1.
The supply pressure hadn’t sharply increase.
The market here will choose a direction to break up or fall down.
If K3 close upon K2 or the resistance,
It is possible that a sharp upthrust of BTC.D will finally come up.
And the risk of other crypto tokens will likely increase.
คำจำกัดสิทธิ์ความรับผิดชอบ
ข้อมูลและบทความไม่ได้มีวัตถุประสงค์เพื่อก่อให้เกิดกิจกรรมทางการเงิน, การลงทุน, การซื้อขาย, ข้อเสนอแนะ หรือคำแนะนำประเภทอื่น ๆ ที่ให้หรือรับรองโดย TradingView อ่านเพิ่มเติมที่ ข้อกำหนดการใช้งาน
คำจำกัดสิทธิ์ความรับผิดชอบ
ข้อมูลและบทความไม่ได้มีวัตถุประสงค์เพื่อก่อให้เกิดกิจกรรมทางการเงิน, การลงทุน, การซื้อขาย, ข้อเสนอแนะ หรือคำแนะนำประเภทอื่น ๆ ที่ให้หรือรับรองโดย TradingView อ่านเพิ่มเติมที่ ข้อกำหนดการใช้งาน