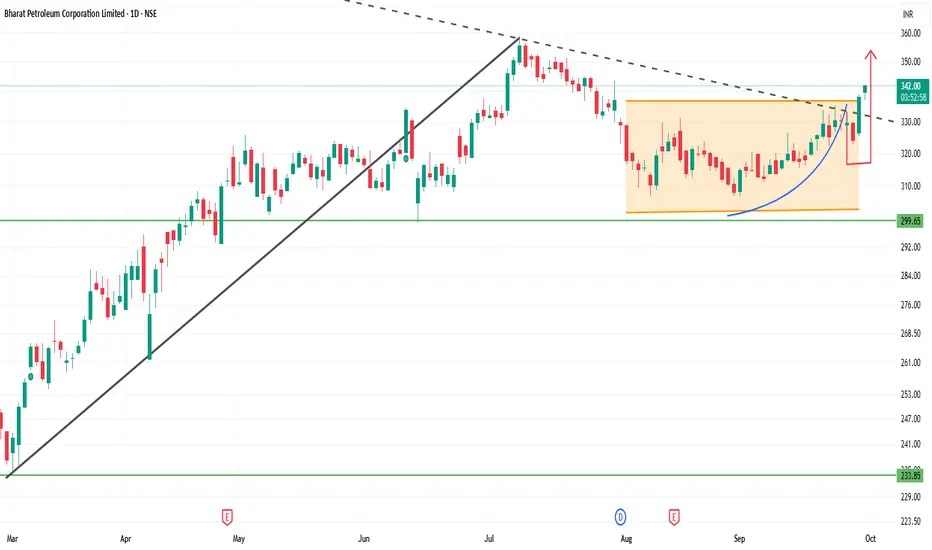
Current Price Snapshot
Last Traded Price: ₹340.20
Day’s Range: ₹337.15 – ₹340.85
52-Week Range: ₹234.01 – ₹373.35
Technical Indicators
RSI (14-day): 53.27 — indicates a neutral momentum.
MACD: 2.49 — suggests a bullish trend.
Moving Averages:
5-day: ₹327.97 — indicates a Sell signal.
50-day: ₹322.14 — indicates a Buy signal.
200-day: ₹296.14 — indicates a Buy signal.
Pivot Points:
Support: ₹327.13
Resistance: ₹337.93
Summary
Above ₹340.85: Potential rise toward ₹345 – ₹350.
Below ₹337.15: Potential fall toward ₹330 – ₹325.
Between ₹330 – ₹340: Likely range-bound movement.
การนำเสนอที่เกี่ยวข้อง
คำจำกัดสิทธิ์ความรับผิดชอบ
The information and publications are not meant to be, and do not constitute, financial, investment, trading, or other types of advice or recommendations supplied or endorsed by TradingView. Read more in the Terms of Use.
การนำเสนอที่เกี่ยวข้อง
คำจำกัดสิทธิ์ความรับผิดชอบ
The information and publications are not meant to be, and do not constitute, financial, investment, trading, or other types of advice or recommendations supplied or endorsed by TradingView. Read more in the Terms of Use.