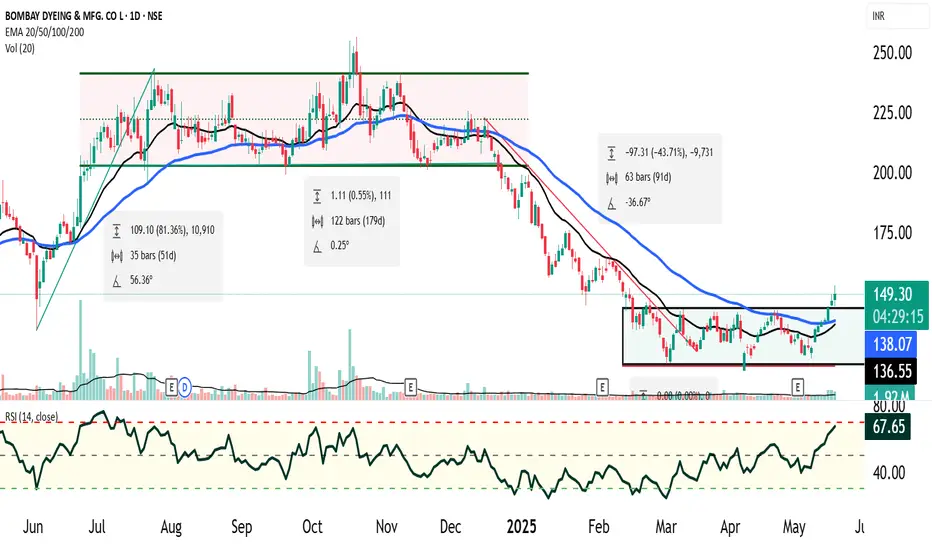
✅ 1. Markup Phase (4 June 2024 – 25 July 2024)
Price movement: ~80% rally.
1. RSI behavior: RSI stayed above neutral (never oversold), frequently nearing overbought.
2. Volume: Increasing — confirmation of strong upside momentum.
3. Participants: Smart money and institutions led the rally.
🚨 2. Distribution Phase (~6 Months)
Price action: Sideways movement in a 20% range
1. Volume: Likely choppy or decreasing, with spikes on down days — a classic distribution sign.
2. RSI: Range-bound between 40–60 — no trend, loss of momentum.
3. Participants: Institutions unloading to retail/inexperienced participants.
🔻 3. Markdown Phase
Breakdown: Support breached after distribution range.
1. Price movement: Dropped ~50% from support breakout.
2. RSI: Frequently oversold — sign of strong weakness.
3. Volume: Likely increased on down days — panic selling.
🧱 4. Accumulation Phase (Last 3 Months)
Price action: Consolidated in ~15% narrow range.
1. RSI: Did not touch oversold zone — indicates seller exhaustion.
2. Participants: Value investors, smart money slowly building positions.
3. Volume: Gradually increasing — early signs of interest.
🔔 Current Technical Signal (20 May 2025)
Breakout: Price has now closed above the resistance of the accumulation range.
Volume: Above-average — confirms breakout strength.
1. RSI: Approaching overbought zone — sign of bullish momentum returning.
2. Price is above 20 EMA and 50 EMA.
3. Expected bullish crossover or confirmation already happened.
📊 Interpretation: Strong Bullish Reversal in Progress
Smart money has likely finished accumulating. Breakout from the accumulation zone with volume, RSI trend, and moving average confirmations all suggest the early stage of a new markup phase is starting. This could be the start of a fresh uptrend or the first leg of a longer bullish swing, especially if:
✅ Actionable Steps (Not Financial Advice)
Entry:
Traders: Consider entry near breakout retest (if occurs).
Investors: Start building position gradually if long-term reversal is confirmed.
Risk Management:
Stop-loss: Just below the accumulation range (tight) or recent swing low (looser).
Position sizing based on volatility and risk appetite.
Targets:
Near-term: 15–20% move based on accumulation range height.
Medium-term: 50–80% potential if this is a true markup phase (mirroring last cycle).
Confirmation Factors:
If you'd like, I can also:
Draw a price cycle chart based on your description.
Help you draft a trade plan or investment thesis.
Pull recent news or updates on Bombay Dyeing (using live data).
Let me know how you'd like to proceed!
Price movement: ~80% rally.
1. RSI behavior: RSI stayed above neutral (never oversold), frequently nearing overbought.
2. Volume: Increasing — confirmation of strong upside momentum.
3. Participants: Smart money and institutions led the rally.
🚨 2. Distribution Phase (~6 Months)
Price action: Sideways movement in a 20% range
1. Volume: Likely choppy or decreasing, with spikes on down days — a classic distribution sign.
2. RSI: Range-bound between 40–60 — no trend, loss of momentum.
3. Participants: Institutions unloading to retail/inexperienced participants.
🔻 3. Markdown Phase
Breakdown: Support breached after distribution range.
1. Price movement: Dropped ~50% from support breakout.
2. RSI: Frequently oversold — sign of strong weakness.
3. Volume: Likely increased on down days — panic selling.
🧱 4. Accumulation Phase (Last 3 Months)
Price action: Consolidated in ~15% narrow range.
1. RSI: Did not touch oversold zone — indicates seller exhaustion.
2. Participants: Value investors, smart money slowly building positions.
3. Volume: Gradually increasing — early signs of interest.
🔔 Current Technical Signal (20 May 2025)
Breakout: Price has now closed above the resistance of the accumulation range.
Volume: Above-average — confirms breakout strength.
1. RSI: Approaching overbought zone — sign of bullish momentum returning.
2. Price is above 20 EMA and 50 EMA.
3. Expected bullish crossover or confirmation already happened.
📊 Interpretation: Strong Bullish Reversal in Progress
Smart money has likely finished accumulating. Breakout from the accumulation zone with volume, RSI trend, and moving average confirmations all suggest the early stage of a new markup phase is starting. This could be the start of a fresh uptrend or the first leg of a longer bullish swing, especially if:
Broader market supports cyclical or value stocks.
Company-specific fundamentals (earnings, business outlook) align with technical cues.
✅ Actionable Steps (Not Financial Advice)
Entry:
Traders: Consider entry near breakout retest (if occurs).
Investors: Start building position gradually if long-term reversal is confirmed.
Risk Management:
Stop-loss: Just below the accumulation range (tight) or recent swing low (looser).
Position sizing based on volatility and risk appetite.
Targets:
Near-term: 15–20% move based on accumulation range height.
Medium-term: 50–80% potential if this is a true markup phase (mirroring last cycle).
Confirmation Factors:
- Look for increasing volume in subsequent up candles.
- Weekly close above breakout zone.
- Fundamental support (news, earnings upgrade, insider buying, etc.).
If you'd like, I can also:
Draw a price cycle chart based on your description.
Help you draft a trade plan or investment thesis.
Pull recent news or updates on Bombay Dyeing (using live data).
Let me know how you'd like to proceed!
คำจำกัดสิทธิ์ความรับผิดชอบ
ข้อมูลและบทความไม่ได้มีวัตถุประสงค์เพื่อก่อให้เกิดกิจกรรมทางการเงิน, การลงทุน, การซื้อขาย, ข้อเสนอแนะ หรือคำแนะนำประเภทอื่น ๆ ที่ให้หรือรับรองโดย TradingView อ่านเพิ่มเติมที่ ข้อกำหนดการใช้งาน
คำจำกัดสิทธิ์ความรับผิดชอบ
ข้อมูลและบทความไม่ได้มีวัตถุประสงค์เพื่อก่อให้เกิดกิจกรรมทางการเงิน, การลงทุน, การซื้อขาย, ข้อเสนอแนะ หรือคำแนะนำประเภทอื่น ๆ ที่ให้หรือรับรองโดย TradingView อ่านเพิ่มเติมที่ ข้อกำหนดการใช้งาน