Short-Term Outlook (1–2 Weeks)
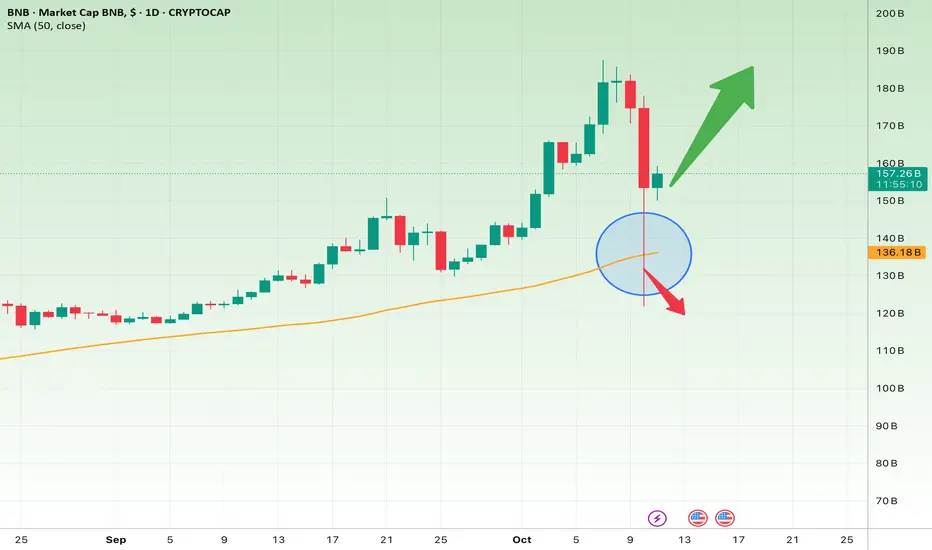
The BNB market cap has recently corrected sharply and is now testing its 50-day SMA around $136B, which acts as strong support.
If BNB can hold above $155B, a rebound toward $170B–$180B is likely.
However, a daily close below $136B would confirm weakness and may push the value down to $125B–$110B.
Short-Term Setup:
Entry Zone: Above $155B after confirmation
Targets: $170B → $180B
Stop Loss: Below $136B
Long-Term Outlook (1–3 Months)
The overall trend remains bullish, and the recent pullback to the SMA50 could be a healthy correction within that uptrend.
If the price stays above $140B–$150B, the next upside targets are $190B–$200B.
But a confirmed break below $136B would signal a structural shift and potential decline toward $110B.
Long-Term Setup:
Bullish Case: Hold above $140B → Targets: $190B → $200B
Stop Loss: Below $136B
Bearish Case: Break below $136B → Targets: $125B → $110B
Stop Loss: Reclaim above $145B
Summary:
BNB sits at a key decision zone. Holding $136B could spark a strong rebound, but losing that support may trigger a deeper correction in the coming weeks.
คำจำกัดสิทธิ์ความรับผิดชอบ
ข้อมูลและบทความไม่ได้มีวัตถุประสงค์เพื่อก่อให้เกิดกิจกรรมทางการเงิน, การลงทุน, การซื้อขาย, ข้อเสนอแนะ หรือคำแนะนำประเภทอื่น ๆ ที่ให้หรือรับรองโดย TradingView อ่านเพิ่มเติมที่ ข้อกำหนดการใช้งาน
คำจำกัดสิทธิ์ความรับผิดชอบ
ข้อมูลและบทความไม่ได้มีวัตถุประสงค์เพื่อก่อให้เกิดกิจกรรมทางการเงิน, การลงทุน, การซื้อขาย, ข้อเสนอแนะ หรือคำแนะนำประเภทอื่น ๆ ที่ให้หรือรับรองโดย TradingView อ่านเพิ่มเติมที่ ข้อกำหนดการใช้งาน