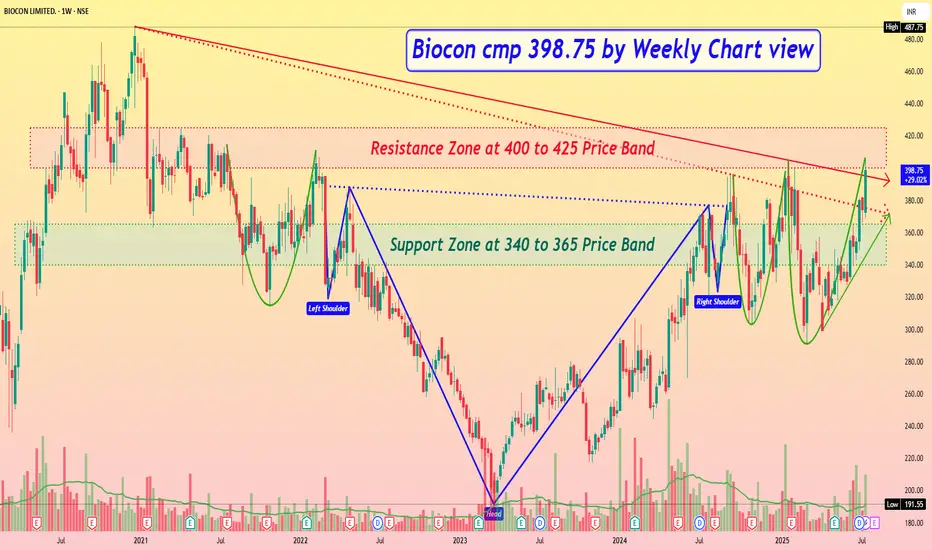
Biocon cmp 398.75 by Weekly Chart view
- Support Zone at 340 to 365 Price Band
- Resistance Zone at 400 to 425 Price Band
- 2nd Falling Resistance Trendline Breakout attempted
- 1st Falling Resistance Trendline Breakout done and sustained
- Stock Price restrained below Resistance Zone after ATH 487.75 in Dec 2020
- Volumes seen galloping heavily and surging well above the avg traded quantity
- Multiple Bullish Technical patterns completed under Resistance Zone Price Band
- *SUBJECT TO*..... Resistance Zone crossover by few days sustained closure, *ONLY then FRESH BREAKOUT* maybe expected*
การนำเสนอที่เกี่ยวข้อง
คำจำกัดสิทธิ์ความรับผิดชอบ
ข้อมูลและบทความไม่ได้มีวัตถุประสงค์เพื่อก่อให้เกิดกิจกรรมทางการเงิน, การลงทุน, การซื้อขาย, ข้อเสนอแนะ หรือคำแนะนำประเภทอื่น ๆ ที่ให้หรือรับรองโดย TradingView อ่านเพิ่มเติมใน ข้อกำหนดการใช้งาน
การนำเสนอที่เกี่ยวข้อง
คำจำกัดสิทธิ์ความรับผิดชอบ
ข้อมูลและบทความไม่ได้มีวัตถุประสงค์เพื่อก่อให้เกิดกิจกรรมทางการเงิน, การลงทุน, การซื้อขาย, ข้อเสนอแนะ หรือคำแนะนำประเภทอื่น ๆ ที่ให้หรือรับรองโดย TradingView อ่านเพิ่มเติมใน ข้อกำหนดการใช้งาน