Stock: Bharti Airtel Limited (BHARTIARTL) - NSE
Timeframe: Daily (D)
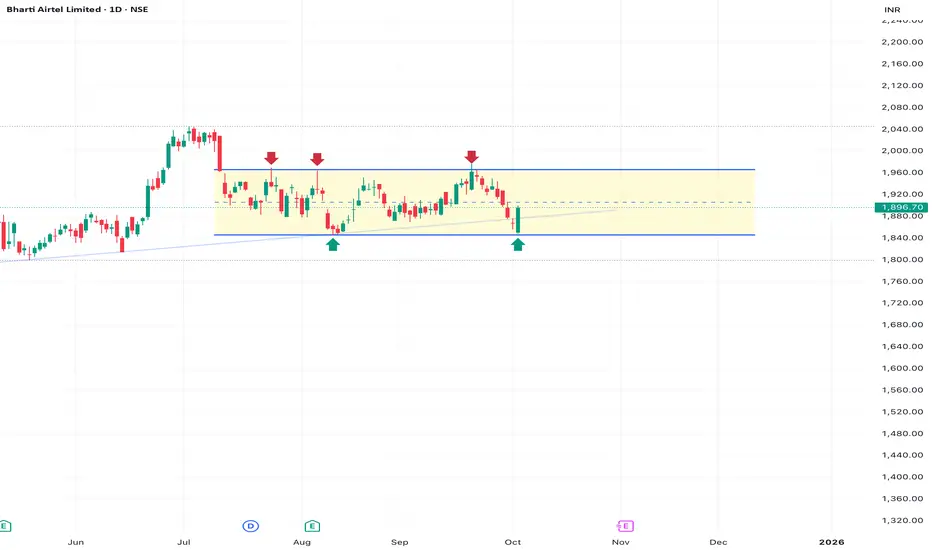
Current Price: ₹1,896.70
1. Market Structure & Chart Pattern Analysis
Observation: The stock has been locked in a clear Rectangular Consolidation (or Sideways Range) since late July 2025, after posting a significant high. This is a crucial area of re-accumulation or distribution before the next major move.
Range High / Resistance (Supply Zone): ₹1,950 to ₹1,970. This area has consistently capped price attempts (marked by red arrows).
Range Low / Support (Demand Zone): ₹1,840 to ₹1,860. This area has provided strong institutional demand (marked by green arrows).
Current Price Action: The most recent daily candle showed a bullish bounce, confirming interest near the mid-to-lower portion of the range, reinforcing the demand below ₹1,860.
2. ICT (Smart Money) Interpretation
In a consolidation, Smart Money Concepts (ICT) focus on trapping traders at the extremes (liquidity sweeps) before expanding price.
Liquidity Pools:
Buy-Side Liquidity (BSL): Sits above the high of the range at ₹1,970. A breakout move will aim to sweep this liquidity.
Sell-Side Liquidity (SSL): Sits below the low of the range at ₹1,840. This is the prime target for a stop-hunt before a potential strong reversal to the upside.
Optimal Trade Zone: The support zone from ₹1,840 to ₹1,860 acts as a prime institutional demand zone. A high-probability long setup involves entering near this low, specifically waiting for a quick wick/sweep below ₹1,840 and a reclaim of the range.
Market Structure Shift (MSS): The larger MSS will only occur with a decisive daily close above ₹1,970 (bullish) or below ₹1,840 (bearish).
3. Swing Trade Plan (BHARTIARTL)
We must prepare for two main scenarios: trading the range and trading the breakout.
Scenario A: High Probability Range Trade (Long)
This setup anticipates a continuation of the bounce off the recent demand.
Action : BUY (Anticipating push to range high)
Entry Zone. : ₹1,860−₹1,880 (Closer to the support is better, but a push above ₹1,900 might signal immediate strength.)
Stop Loss (SL) : Below ₹1,830 (Must be placed below the SSL/Range Low to protect against an invalidation of the consolidation structure).
Target 1 (T1) : ₹1,930−₹1,950 (Mid-range resistance).
Target 2 (T2) : ₹1,970 (Range High / BSL).
Scenario B: Breakout Trade (Long - Requires Patience)
This setup initiates only after the consolidation is clearly broken to the upside, signaling the start of the next large trend wave.
Action : BUY (Positional/Expansion)
Entry Zone. : Breakout & Retest of ₹1,970. Wait for a decisive Daily candle close above ₹1,970, then enter on the retest of ₹1,970 acting as new support.
Stop Loss (SL) : Below ₹1,920 (Place below the last significant swing low of the previous range).
Target : ₹2,100−₹2,200 (Measured move from the consolidation box).
Risk Disclaimer: This is a technical analysis based on chart patterns and institutional concepts for educational purposes only. It is not financial advice. Trading involves risk, and you are responsible for your own capital. Always adhere to strict risk management principles.
Timeframe: Daily (D)
Current Price: ₹1,896.70
1. Market Structure & Chart Pattern Analysis
Observation: The stock has been locked in a clear Rectangular Consolidation (or Sideways Range) since late July 2025, after posting a significant high. This is a crucial area of re-accumulation or distribution before the next major move.
Range High / Resistance (Supply Zone): ₹1,950 to ₹1,970. This area has consistently capped price attempts (marked by red arrows).
Range Low / Support (Demand Zone): ₹1,840 to ₹1,860. This area has provided strong institutional demand (marked by green arrows).
Current Price Action: The most recent daily candle showed a bullish bounce, confirming interest near the mid-to-lower portion of the range, reinforcing the demand below ₹1,860.
2. ICT (Smart Money) Interpretation
In a consolidation, Smart Money Concepts (ICT) focus on trapping traders at the extremes (liquidity sweeps) before expanding price.
Liquidity Pools:
Buy-Side Liquidity (BSL): Sits above the high of the range at ₹1,970. A breakout move will aim to sweep this liquidity.
Sell-Side Liquidity (SSL): Sits below the low of the range at ₹1,840. This is the prime target for a stop-hunt before a potential strong reversal to the upside.
Optimal Trade Zone: The support zone from ₹1,840 to ₹1,860 acts as a prime institutional demand zone. A high-probability long setup involves entering near this low, specifically waiting for a quick wick/sweep below ₹1,840 and a reclaim of the range.
Market Structure Shift (MSS): The larger MSS will only occur with a decisive daily close above ₹1,970 (bullish) or below ₹1,840 (bearish).
3. Swing Trade Plan (BHARTIARTL)
We must prepare for two main scenarios: trading the range and trading the breakout.
Scenario A: High Probability Range Trade (Long)
This setup anticipates a continuation of the bounce off the recent demand.
Action : BUY (Anticipating push to range high)
Entry Zone. : ₹1,860−₹1,880 (Closer to the support is better, but a push above ₹1,900 might signal immediate strength.)
Stop Loss (SL) : Below ₹1,830 (Must be placed below the SSL/Range Low to protect against an invalidation of the consolidation structure).
Target 1 (T1) : ₹1,930−₹1,950 (Mid-range resistance).
Target 2 (T2) : ₹1,970 (Range High / BSL).
Scenario B: Breakout Trade (Long - Requires Patience)
This setup initiates only after the consolidation is clearly broken to the upside, signaling the start of the next large trend wave.
Action : BUY (Positional/Expansion)
Entry Zone. : Breakout & Retest of ₹1,970. Wait for a decisive Daily candle close above ₹1,970, then enter on the retest of ₹1,970 acting as new support.
Stop Loss (SL) : Below ₹1,920 (Place below the last significant swing low of the previous range).
Target : ₹2,100−₹2,200 (Measured move from the consolidation box).
Risk Disclaimer: This is a technical analysis based on chart patterns and institutional concepts for educational purposes only. It is not financial advice. Trading involves risk, and you are responsible for your own capital. Always adhere to strict risk management principles.
การซื้อขายยังคงดำเนินอยู่
T1 & T2 done. Trail SL and book partial profits. คำจำกัดสิทธิ์ความรับผิดชอบ
ข้อมูลและบทความไม่ได้มีวัตถุประสงค์เพื่อก่อให้เกิดกิจกรรมทางการเงิน, การลงทุน, การซื้อขาย, ข้อเสนอแนะ หรือคำแนะนำประเภทอื่น ๆ ที่ให้หรือรับรองโดย TradingView อ่านเพิ่มเติมใน ข้อกำหนดการใช้งาน
คำจำกัดสิทธิ์ความรับผิดชอบ
ข้อมูลและบทความไม่ได้มีวัตถุประสงค์เพื่อก่อให้เกิดกิจกรรมทางการเงิน, การลงทุน, การซื้อขาย, ข้อเสนอแนะ หรือคำแนะนำประเภทอื่น ๆ ที่ให้หรือรับรองโดย TradingView อ่านเพิ่มเติมใน ข้อกำหนดการใช้งาน