summary of the (Beam Therapeutics Inc. – BEAM) Daily Time fram
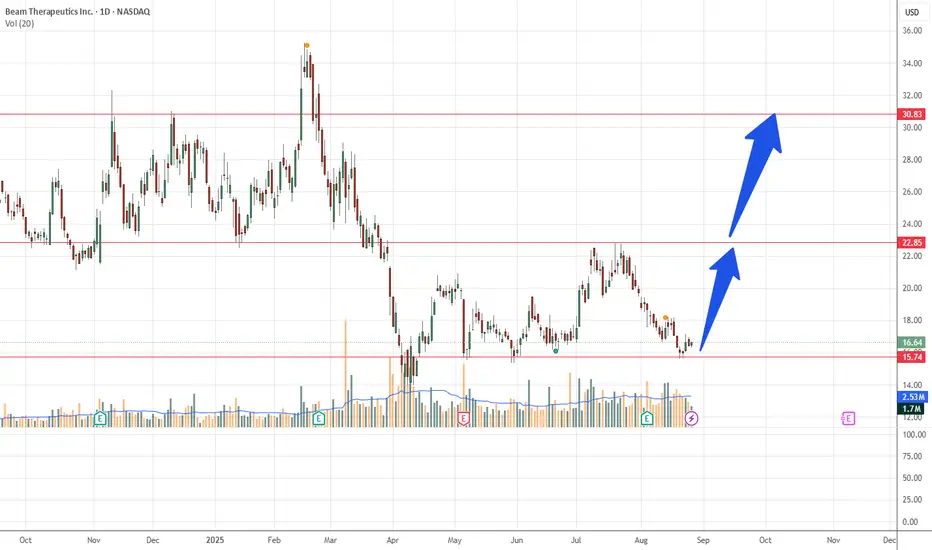
Current Price: Around $16.63 (slightly above the $16 support zone).
Support Zone: Strong support near $15.74. The stock recently bounced from this level.
Resistance Levels:
First key resistance around $22.85 – $23.24.
Next major resistance near $30.79 – $30.83.
Volume: Recent trading volume ~1.2M, close to the average. No unusual spike in volume.
First target if momentum continues is ~$23.2.
If it breaks above that, the next target zone is around $30.8.
Trend: The stock has been in a downtrend but may be forming a short-term bottom at $15.7 support.
📌 In short: BEAM is trying to bounce from strong support. The key upside checkpoints are $23 and then $31. A breakdown below $15.7 would invalidate the bullish setup.
การซื้อขายยังคงดำเนินอยู่
ปิดการเทรด: ถึงเป้าหมายการทำกำไร
First target reachedบันทึก
reached second target คำจำกัดสิทธิ์ความรับผิดชอบ
ข้อมูลและบทความไม่ได้มีวัตถุประสงค์เพื่อก่อให้เกิดกิจกรรมทางการเงิน, การลงทุน, การซื้อขาย, ข้อเสนอแนะ หรือคำแนะนำประเภทอื่น ๆ ที่ให้หรือรับรองโดย TradingView อ่านเพิ่มเติมใน ข้อกำหนดการใช้งาน
คำจำกัดสิทธิ์ความรับผิดชอบ
ข้อมูลและบทความไม่ได้มีวัตถุประสงค์เพื่อก่อให้เกิดกิจกรรมทางการเงิน, การลงทุน, การซื้อขาย, ข้อเสนอแนะ หรือคำแนะนำประเภทอื่น ๆ ที่ให้หรือรับรองโดย TradingView อ่านเพิ่มเติมใน ข้อกำหนดการใช้งาน