ลดลง
Bitcoin Cash chart is still down
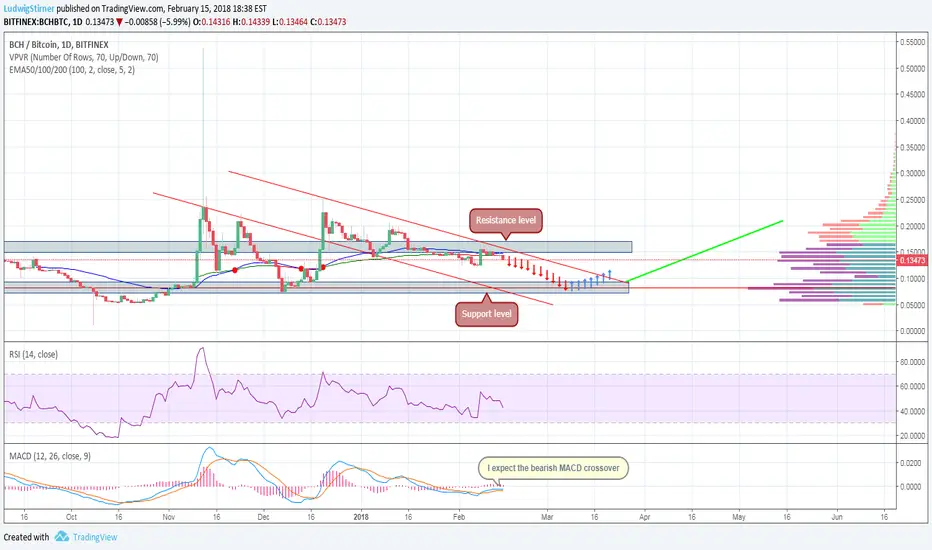
Long term, the trend of the Bitcoin Cash chart is still down. The 100-Day EMA provide significant resistance. The upper descending trend line also provide strong resistance.
RSI is below 50, a sign of an down trend. The MACD turned down but earlier the MACD showed positive divergence indicating the uptrend would begin however it might possible to be a fake buy signal.
RSI is below 50, a sign of an down trend. The MACD turned down but earlier the MACD showed positive divergence indicating the uptrend would begin however it might possible to be a fake buy signal.
คำจำกัดสิทธิ์ความรับผิดชอบ
ข้อมูลและบทความไม่ได้มีวัตถุประสงค์เพื่อก่อให้เกิดกิจกรรมทางการเงิน, การลงทุน, การซื้อขาย, ข้อเสนอแนะ หรือคำแนะนำประเภทอื่น ๆ ที่ให้หรือรับรองโดย TradingView อ่านเพิ่มเติมที่ ข้อกำหนดการใช้งาน
คำจำกัดสิทธิ์ความรับผิดชอบ
ข้อมูลและบทความไม่ได้มีวัตถุประสงค์เพื่อก่อให้เกิดกิจกรรมทางการเงิน, การลงทุน, การซื้อขาย, ข้อเสนอแนะ หรือคำแนะนำประเภทอื่น ๆ ที่ให้หรือรับรองโดย TradingView อ่านเพิ่มเติมที่ ข้อกำหนดการใช้งาน