Based on the charts and the market's performance on Wednesday, October 15, the Bank Nifty experienced a strong, volatile session, successfully defending a key support and confirming the continuation of its short-term bullish trend.
Detailed Market Structure Breakdown
4-Hour Chart (Macro Trend)
Structure: The Bank Nifty is in a strong bullish uptrend. The market dipped sharply on Monday but found buying interest at the lower trendline of the ascending channel and the 55,800 - 56,000 demand zone. The strong bullish candle on Wednesday (Oct 15th) confirmed the Market Structure Shift (MSS) back to the upside, breaking the corrective trendline.
Key Levels:
Major Supply (Resistance): 57,000 - 57,200. This area is the immediate overhead hurdle, aligning with the upper trendline of the channel and the psychological 57,000 mark.
Major Demand (Support): 56,200 - 56,400. This area includes the lower trendline of the ascending channel and a prior FVG (Fair Value Gap), serving as the must-hold zone for the continuation of the rally.
Outlook: The short-term bias is strongly bullish. The market is poised to challenge the 57,000 resistance.
1-Hour Chart (Intermediate View)
Structure: The 1H chart shows a clear Break of Structure (BOS) on the upside. The price is trading within a steep ascending channel, having successfully retested and bounced off the lower channel trendline on the open.
Key Levels:
Immediate Resistance: 57,000.
Immediate Support: 56,600 (Recent swing low and FVG support).
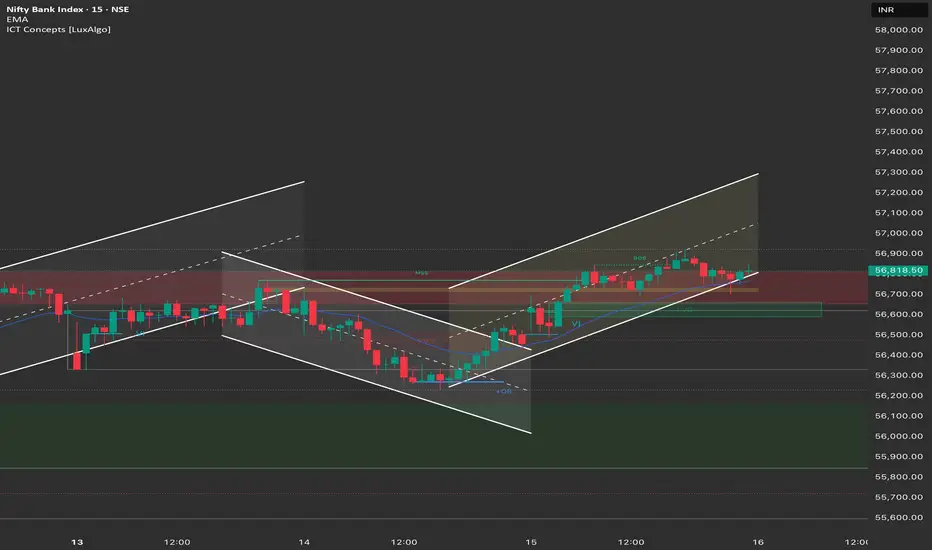
15-Minute Chart (Intraday View)
Structure: The 15M chart confirms the strong bullish momentum. The market closed right at the upper end of its intraday range, and is currently consolidating in a small bullish flag pattern. The price is trading above the upper boundary of the previous corrective channel.
Key Levels:
Intraday Supply: 57,000.
Intraday Demand: 56,600.
Outlook: Strongly Bullish.
📈 Trade Plan (Thursday, 16th October)
Market Outlook: The Bank Nifty is displaying strong bullish momentum and is positioned for a move toward the 57,000 psychological mark. The primary strategy will be to buy on continuation.
Bullish Scenario (Primary Plan)
Justification: The market has confirmed a strong reversal, and the sustained move within the ascending channel favors continuation toward the next major supply zone.
Entry: Long entry on a decisive break and 15-minute candle close above 57,000. Alternatively, look for a dip entry near 56,600 - 56,700 (the immediate support/FVG zone).
Stop Loss (SL): Place a stop loss below 56,400 (below the lower channel trendline).
Targets:
T1: 57,300 (Previous all-time high zone).
T2: 57,600 (Extension target).
Bearish Scenario (Counter-Trend Plan)
Justification: Only valid if there is sharp profit booking or negative news that causes the price to break the bullish structure.
Trigger: A decisive break and 1-hour candle close below 56,200.
Entry: Short entry below 56,200.
Stop Loss (SL): Above 56,500.
Targets:
T1: 55,800 (Major FVG support).
T2: 55,400 (Major demand zone).
Key Levels for Observation:
Immediate Decision Point: 56,800 - 57,000 zone.
Bullish Confirmation: A break and sustained move above 57,000.
Bearish Warning: A move below 56,400 suggests the rally is failing.
Major Event: Infosys, LTIMindtree, Wipro Q2 Results (will influence overall sentiment).
Line in the Sand: 56,200. Below this level, the short-term bullish bias is nullified.
คำจำกัดสิทธิ์ความรับผิดชอบ
ข้อมูลและบทความไม่ได้มีวัตถุประสงค์เพื่อก่อให้เกิดกิจกรรมทางการเงิน, การลงทุน, การซื้อขาย, ข้อเสนอแนะ หรือคำแนะนำประเภทอื่น ๆ ที่ให้หรือรับรองโดย TradingView อ่านเพิ่มเติมใน ข้อกำหนดการใช้งาน
คำจำกัดสิทธิ์ความรับผิดชอบ
ข้อมูลและบทความไม่ได้มีวัตถุประสงค์เพื่อก่อให้เกิดกิจกรรมทางการเงิน, การลงทุน, การซื้อขาย, ข้อเสนอแนะ หรือคำแนะนำประเภทอื่น ๆ ที่ให้หรือรับรองโดย TradingView อ่านเพิ่มเติมใน ข้อกำหนดการใช้งาน