📊 BANK NIFTY 15-Min Trading Plan for 2-May-2025
(Gap Opening Consideration: 200+ Points | Chart-based | Structure-Oriented)
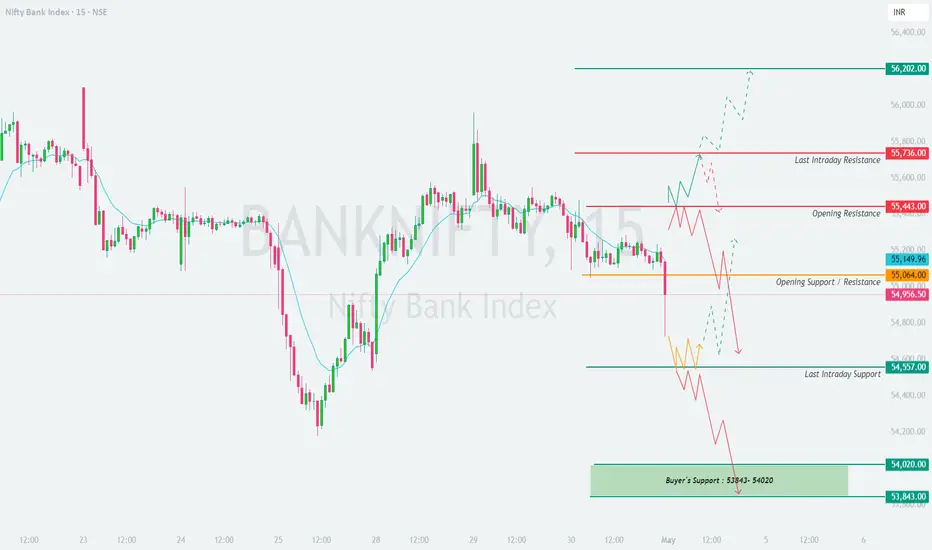
📍 Previous Close: 54,956.50
📌 Important Chart Levels to Monitor:
🔺 Resistance Zones:
🔴 Opening Resistance: 55,443
🔴 Last Intraday Resistance: 55,736
🟢 Possible Upside Target: 56,202
🔻 Support Zones:
🟧 Opening Support/Resistance Flip Zone: 55,064
🟨 Last Intraday Support: 54,557
🟩 Buyer’s Strong Support: 54,020 – 53,843
🟥 Scenario 1: Gap-Up Opening (Above 55,443) 🚀
📚 Educational Tip: Gaps into resistance zones often trap early bulls. Let price prove its strength by sustaining above key resistance before committing.
🟨 Scenario 2: Flat Opening (Between 55,064 – 54,557) ⚖️
📚 Educational Tip: Flat opens offer excellent trades post zone breakout or reversal setups. Don’t jump early—allow structure to evolve.
🟩 Scenario 3: Gap-Down Opening (Below 54,557) 📉
📚 Educational Tip: Gap-downs into strong support zones often offer best risk-reward trades. Let buyers defend the zone first before buying blindly.
💡 Options Risk Management Tips for Intraday Traders ⚠️
📝 Summary & Conclusion:
✅ Gap-Up Opening (Above 55,443): Be cautious of reversal setups. Longs only if strength builds above 55,736. Watch for gap-fade traps.
✅ Flat Opening (Between 55,064 – 54,557): Wait for a range breakout. Levels like 55,443 and 54,557 are the key breakout boundaries.
✅ Gap-Down Opening (Below 54,557): Watch 54,020 – 53,843 zone closely for long reversal opportunities. Failing this zone could bring panic selling.
📌 Stay objective. Let price come to your plan. Patience, structure, and strict risk control will separate professionals from impulsive traders.
⚠️ Disclaimer:
I am not a SEBI-registered analyst. The above analysis is shared purely for educational purposes. Please consult a certified financial advisor before taking any trade or investment decision.
(Gap Opening Consideration: 200+ Points | Chart-based | Structure-Oriented)
📍 Previous Close: 54,956.50
📌 Important Chart Levels to Monitor:
🔺 Resistance Zones:
🔴 Opening Resistance: 55,443
🔴 Last Intraday Resistance: 55,736
🟢 Possible Upside Target: 56,202
🔻 Support Zones:
🟧 Opening Support/Resistance Flip Zone: 55,064
🟨 Last Intraday Support: 54,557
🟩 Buyer’s Strong Support: 54,020 – 53,843
🟥 Scenario 1: Gap-Up Opening (Above 55,443) 🚀
- [] A gap-up above 55,443 directly opens into the resistance zone; this area is a supply pocket where sellers are likely to be active.
[] Avoid aggressive longs unless a clean 15-min breakout candle closes above 55,443 with follow-through price action toward 55,736.
[] If Nifty Bank gets rejected around 55,443–55,736, expect a pullback to test the Opening Support at 55,064 or even 54,956.
[] For long trades beyond 55,736, wait for price to establish strength above this zone. Only then should targets like 56,202 be considered. - A “gap-up failure” scenario is possible if prices open higher but close back below 55,443 early—this could attract intraday shorts.
📚 Educational Tip: Gaps into resistance zones often trap early bulls. Let price prove its strength by sustaining above key resistance before committing.
🟨 Scenario 2: Flat Opening (Between 55,064 – 54,557) ⚖️
- [] A flat or minor gap open within this range places Nifty Bank inside the neutral, indecisive zone—both buyers and sellers will fight for dominance.
[] Let the first 15–30 mins play out and observe if price is rejecting the Opening Resistance at 55,443 or taking support at 54,557.
[] If price climbs above 55,443 with structure, a move toward 55,736 becomes likely. Above that, watch for 56,202 with momentum.
[] A break below 54,557 could bring in further weakness with a possible slide toward 54,020 – 53,843, but this area is a demand zone, so reversals may occur. - Look for directional conviction from price action before initiating trades. Range-bound play can eat option premiums.
📚 Educational Tip: Flat opens offer excellent trades post zone breakout or reversal setups. Don’t jump early—allow structure to evolve.
🟩 Scenario 3: Gap-Down Opening (Below 54,557) 📉
- [] A gap-down below 54,557 brings the spotlight directly to the Buyer’s Demand Zone: 54,020 – 53,843.
[] If price shows bullish reversal candles (like pin bars, engulfing patterns) in this demand pocket, aggressive longs can be attempted with stop loss just below 53,843.
[] However, if this zone fails to hold, we could witness a continuation sell-off targeting deeper zones (which will need re-mapping on intraday basis).
[] Be cautious of chasing shorts directly into demand. Best trades arise if price bounces first and then rejects resistance levels like 54,557 from below. - Wait for rejection + confirmation (e.g., a lower high and breakdown candle) to re-enter shorts after a minor bounce.
📚 Educational Tip: Gap-downs into strong support zones often offer best risk-reward trades. Let buyers defend the zone first before buying blindly.
💡 Options Risk Management Tips for Intraday Traders ⚠️
- [] Don’t trade immediately after market opens—wait 5–10 mins for option premiums to settle.
[] Always use a stop loss and define your risk before entering a position.
[] Prefer trading ITM or ATM options with directional bias to avoid premium decay.
[] If buying options, be aware of time decay especially during sideways markets—avoid overtrading.
[] Use vertical spreads (Bull Call / Bear Put) in high IV environments to reduce theta loss.
[] Avoid averaging losing trades—respect your maximum daily loss limits (e.g., 2% of capital). - Don't convert intraday positions into swing trades emotionally. Accept small losses and stay in the game.
📝 Summary & Conclusion:
✅ Gap-Up Opening (Above 55,443): Be cautious of reversal setups. Longs only if strength builds above 55,736. Watch for gap-fade traps.
✅ Flat Opening (Between 55,064 – 54,557): Wait for a range breakout. Levels like 55,443 and 54,557 are the key breakout boundaries.
✅ Gap-Down Opening (Below 54,557): Watch 54,020 – 53,843 zone closely for long reversal opportunities. Failing this zone could bring panic selling.
📌 Stay objective. Let price come to your plan. Patience, structure, and strict risk control will separate professionals from impulsive traders.
⚠️ Disclaimer:
I am not a SEBI-registered analyst. The above analysis is shared purely for educational purposes. Please consult a certified financial advisor before taking any trade or investment decision.
คำจำกัดสิทธิ์ความรับผิดชอบ
ข้อมูลและบทความไม่ได้มีวัตถุประสงค์เพื่อก่อให้เกิดกิจกรรมทางการเงิน, การลงทุน, การซื้อขาย, ข้อเสนอแนะ หรือคำแนะนำประเภทอื่น ๆ ที่ให้หรือรับรองโดย TradingView อ่านเพิ่มเติมใน ข้อกำหนดการใช้งาน
คำจำกัดสิทธิ์ความรับผิดชอบ
ข้อมูลและบทความไม่ได้มีวัตถุประสงค์เพื่อก่อให้เกิดกิจกรรมทางการเงิน, การลงทุน, การซื้อขาย, ข้อเสนอแนะ หรือคำแนะนำประเภทอื่น ๆ ที่ให้หรือรับรองโดย TradingView อ่านเพิ่มเติมใน ข้อกำหนดการใช้งาน