BANK NIFTY TRADING PLAN – 04-Sep-2025
📌 Key Levels to Watch:
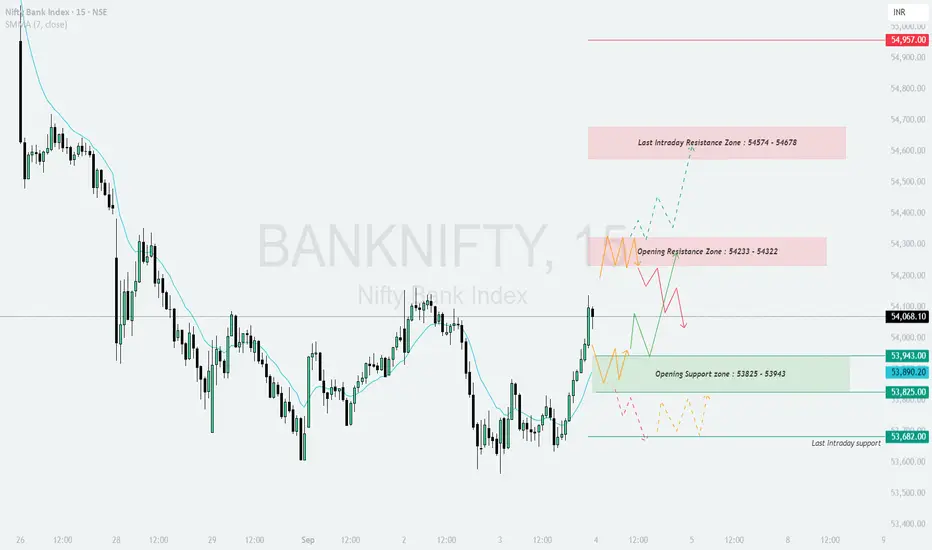
Opening Resistance Zone: 54,233 – 54,322
Last Intraday Resistance Zone: 54,574 – 54,678
Major Resistance: 54,957
Opening Support Zone: 53,825 – 53,943
Last Intraday Support: 53,682
These levels will define intraday trend strength and reversals. Let’s analyze scenarios:
🔼 1. Gap-Up Opening (200+ points above 54,233)
If Bank Nifty opens significantly higher above 54,233, it will enter the resistance zone and buyers will aim to test 54,574 – 54,678.
📌 Plan of Action:
👉 Educational Note: Gap-ups near resistance zones can often trap late buyers. Always wait for confirmation before entering fresh longs.
➖ 2. Flat Opening (Around 53,900 – 54,100)
A flat start near current levels indicates balance. Intraday movement will depend on whether support or resistance breaks first.
📌 Plan of Action:
👉 Educational Note: Flat openings often provide the cleanest intraday trends once the first 30 minutes establish direction.
🔽 3. Gap-Down Opening (200+ points below 53,825)
If Bank Nifty opens weak below 53,825, sellers will take control, with supports coming into play.
📌 Plan of Action:
👉 Educational Note: Gap-downs can trigger panic selling, but experienced traders should watch for reversal patterns near strong supports.
🛡️ Risk Management Tips for Options Traders
📌 Summary & Conclusion
🟢 Above 54,233 → Upside towards 54,574 – 54,678, extended 54,957.
🟧 Flat Opening → Range-bound between 53,825 – 54,322; breakout will decide direction.
🔴 Below 53,825 → Weakness towards 53,682 and possibly lower.
⚠️ Key Pivot Zone: 53,825 – 53,943 will act as the critical battleground for bulls and bears.
⚠️ Disclaimer: I am not a SEBI-registered analyst. This trading plan is for educational purposes only and should not be treated as financial advice. Please consult your financial advisor before making trading decisions.
📌 Key Levels to Watch:
Opening Resistance Zone: 54,233 – 54,322
Last Intraday Resistance Zone: 54,574 – 54,678
Major Resistance: 54,957
Opening Support Zone: 53,825 – 53,943
Last Intraday Support: 53,682
These levels will define intraday trend strength and reversals. Let’s analyze scenarios:
🔼 1. Gap-Up Opening (200+ points above 54,233)
If Bank Nifty opens significantly higher above 54,233, it will enter the resistance zone and buyers will aim to test 54,574 – 54,678.
📌 Plan of Action:
- [] Sustaining above 54,322 can lead to a quick rally towards 54,574 – 54,678.
[] Booking profits near this zone is advised, as sellers may step in. - If momentum extends, the next target will be 54,957, but only if 54,678 breaks with strength.
👉 Educational Note: Gap-ups near resistance zones can often trap late buyers. Always wait for confirmation before entering fresh longs.
➖ 2. Flat Opening (Around 53,900 – 54,100)
A flat start near current levels indicates balance. Intraday movement will depend on whether support or resistance breaks first.
📌 Plan of Action:
- [] Holding above 53,943 (Opening Support) can push price towards 54,233 – 54,322 (Resistance Zone).
[] A breakout above this zone may open the path to 54,574 – 54,678. - If price slips below 53,825, weakness can extend towards 53,682.
👉 Educational Note: Flat openings often provide the cleanest intraday trends once the first 30 minutes establish direction.
🔽 3. Gap-Down Opening (200+ points below 53,825)
If Bank Nifty opens weak below 53,825, sellers will take control, with supports coming into play.
📌 Plan of Action:
- [] A gap-down below 53,825 increases probability of a slide towards 53,682 (Last Intraday Support).
[] If 53,682 breaks, the downside can intensify with sharp selling. - Any bounce from this zone should be treated cautiously unless price regains 53,825 – 53,943.
👉 Educational Note: Gap-downs can trigger panic selling, but experienced traders should watch for reversal patterns near strong supports.
🛡️ Risk Management Tips for Options Traders
- [] Always place stop losses based on hourly close.
[] Limit risk to 1–2% of trading capital per position.
[] Scale out profits – exit part at first target, hold balance for extended moves.
[] Avoid over-leveraging in weekly expiry days to reduce volatility risk. - When uncertainty is high, prefer spreads (Bull Call / Bear Put) over naked options.
📌 Summary & Conclusion
🟢 Above 54,233 → Upside towards 54,574 – 54,678, extended 54,957.
🟧 Flat Opening → Range-bound between 53,825 – 54,322; breakout will decide direction.
🔴 Below 53,825 → Weakness towards 53,682 and possibly lower.
⚠️ Key Pivot Zone: 53,825 – 53,943 will act as the critical battleground for bulls and bears.
⚠️ Disclaimer: I am not a SEBI-registered analyst. This trading plan is for educational purposes only and should not be treated as financial advice. Please consult your financial advisor before making trading decisions.
คำจำกัดสิทธิ์ความรับผิดชอบ
ข้อมูลและบทความไม่ได้มีวัตถุประสงค์เพื่อก่อให้เกิดกิจกรรมทางการเงิน, การลงทุน, การซื้อขาย, ข้อเสนอแนะ หรือคำแนะนำประเภทอื่น ๆ ที่ให้หรือรับรองโดย TradingView อ่านเพิ่มเติมที่ ข้อกำหนดการใช้งาน
คำจำกัดสิทธิ์ความรับผิดชอบ
ข้อมูลและบทความไม่ได้มีวัตถุประสงค์เพื่อก่อให้เกิดกิจกรรมทางการเงิน, การลงทุน, การซื้อขาย, ข้อเสนอแนะ หรือคำแนะนำประเภทอื่น ๆ ที่ให้หรือรับรองโดย TradingView อ่านเพิ่มเติมที่ ข้อกำหนดการใช้งาน