Detailed Market Structure Breakdown
4-Hour Chart (Macro Trend)
Structure: The Bank Nifty is still in a bullish uptrend, having rebounded sharply from the 54,250 base. However, the price has failed to break the key supply zone of 56,400 - 56,600. The large red candle on Wednesday signals a clear rejection from this zone. The price has dropped below the lower trendline of the very steep short-term ascending channel.
Key Levels:
Major Supply (Resistance): 56,400 - 56,600. This remains the critical overhead hurdle.
Major Demand (Support): 55,400 - 55,600. This area, which includes a short-term FVG (Fair Value Gap), is the next major support.
Outlook: The trend has shifted to sideways-to-bearish for the short term. The market is expected to consolidate or correct towards 55,600.
1-Hour Chart (Intermediate View)
Structure: The 1H chart shows a clear Market Structure Shift (MSS) to the downside. The price broke the immediate swing low and the lower trendline of the ascending channel, confirming the corrective trend. The market is now moving within a newly formed descending channel.
Key Levels:
Immediate Resistance: The upper trendline of the descending channel, near 56,200.
Immediate Support: 55,750 (The recent consolidation base).
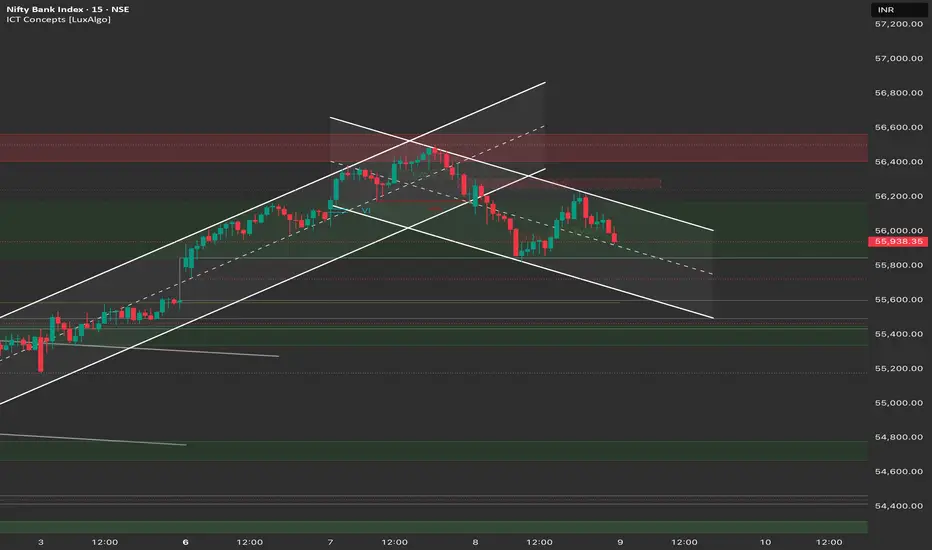
15-Minute Chart (Intraday View)
Structure: The 15M chart confirms a clear descending channel since the 56,400 high, marked by lower highs and lower lows. The market closed below the blue EMA, indicating strong bearish momentum.
Key Levels:
Intraday Supply: 56,050 - 56,150. This area is the recent swing high and aligns with the descending channel's upper boundary.
Intraday Demand: 55,750.
Outlook: Bearish. A "Sell on Rise" strategy is recommended near 56,050 - 56,150.
📈 Trade Plan (Thursday, 9th October)
Market Outlook: The Bank Nifty has initiated a short-term correction after hitting major resistance. The plan focuses on capitalizing on the continuation of the short-term downtrend.
Bearish Scenario (Primary Plan)
Justification: The breakdown of the steep channel and the rejection from 56,400 favor continuation toward the next major support.
Entry: Short entry on a successful retest and rejection of the 56,050 - 56,150 zone (upper channel resistance). Alternatively, short a decisive break and 15-minute candle close below 55,700.
Stop Loss (SL): Place a stop loss above 56,300.
Targets:
T1: 55,400 (Major FVG support).
T2: 55,100 (Psychological support).
Bullish Scenario (Counter-Trend/Reversal Plan)
Justification: Only valid if strong buying emerges to reclaim the entire breakdown structure.
Trigger: A sustained move and close above the major resistance at 56,400.
Entry: Long entry on a confirmed 15-minute close above 56,400.
Stop Loss (SL): Below 56,200.
Targets:
T1: 56,600 (Major supply zone).
T2: 56,800 (Extension target).
Key Levels for Observation:
Immediate Decision Point: 55,700 - 56,150 zone.
Bearish Confirmation: A break and sustained move below 55,700.
Bullish Confirmation: A move back above 56,200.
Major Event: TCS Q2 Results (will heavily influence the market open).
Line in the Sand: 55,600. Below this level, the sellers gain control of the intermediate trend.
4-Hour Chart (Macro Trend)
Structure: The Bank Nifty is still in a bullish uptrend, having rebounded sharply from the 54,250 base. However, the price has failed to break the key supply zone of 56,400 - 56,600. The large red candle on Wednesday signals a clear rejection from this zone. The price has dropped below the lower trendline of the very steep short-term ascending channel.
Key Levels:
Major Supply (Resistance): 56,400 - 56,600. This remains the critical overhead hurdle.
Major Demand (Support): 55,400 - 55,600. This area, which includes a short-term FVG (Fair Value Gap), is the next major support.
Outlook: The trend has shifted to sideways-to-bearish for the short term. The market is expected to consolidate or correct towards 55,600.
1-Hour Chart (Intermediate View)
Structure: The 1H chart shows a clear Market Structure Shift (MSS) to the downside. The price broke the immediate swing low and the lower trendline of the ascending channel, confirming the corrective trend. The market is now moving within a newly formed descending channel.
Key Levels:
Immediate Resistance: The upper trendline of the descending channel, near 56,200.
Immediate Support: 55,750 (The recent consolidation base).
15-Minute Chart (Intraday View)
Structure: The 15M chart confirms a clear descending channel since the 56,400 high, marked by lower highs and lower lows. The market closed below the blue EMA, indicating strong bearish momentum.
Key Levels:
Intraday Supply: 56,050 - 56,150. This area is the recent swing high and aligns with the descending channel's upper boundary.
Intraday Demand: 55,750.
Outlook: Bearish. A "Sell on Rise" strategy is recommended near 56,050 - 56,150.
📈 Trade Plan (Thursday, 9th October)
Market Outlook: The Bank Nifty has initiated a short-term correction after hitting major resistance. The plan focuses on capitalizing on the continuation of the short-term downtrend.
Bearish Scenario (Primary Plan)
Justification: The breakdown of the steep channel and the rejection from 56,400 favor continuation toward the next major support.
Entry: Short entry on a successful retest and rejection of the 56,050 - 56,150 zone (upper channel resistance). Alternatively, short a decisive break and 15-minute candle close below 55,700.
Stop Loss (SL): Place a stop loss above 56,300.
Targets:
T1: 55,400 (Major FVG support).
T2: 55,100 (Psychological support).
Bullish Scenario (Counter-Trend/Reversal Plan)
Justification: Only valid if strong buying emerges to reclaim the entire breakdown structure.
Trigger: A sustained move and close above the major resistance at 56,400.
Entry: Long entry on a confirmed 15-minute close above 56,400.
Stop Loss (SL): Below 56,200.
Targets:
T1: 56,600 (Major supply zone).
T2: 56,800 (Extension target).
Key Levels for Observation:
Immediate Decision Point: 55,700 - 56,150 zone.
Bearish Confirmation: A break and sustained move below 55,700.
Bullish Confirmation: A move back above 56,200.
Major Event: TCS Q2 Results (will heavily influence the market open).
Line in the Sand: 55,600. Below this level, the sellers gain control of the intermediate trend.
คำจำกัดสิทธิ์ความรับผิดชอบ
ข้อมูลและบทความไม่ได้มีวัตถุประสงค์เพื่อก่อให้เกิดกิจกรรมทางการเงิน, การลงทุน, การซื้อขาย, ข้อเสนอแนะ หรือคำแนะนำประเภทอื่น ๆ ที่ให้หรือรับรองโดย TradingView อ่านเพิ่มเติมที่ ข้อกำหนดการใช้งาน
คำจำกัดสิทธิ์ความรับผิดชอบ
ข้อมูลและบทความไม่ได้มีวัตถุประสงค์เพื่อก่อให้เกิดกิจกรรมทางการเงิน, การลงทุน, การซื้อขาย, ข้อเสนอแนะ หรือคำแนะนำประเภทอื่น ๆ ที่ให้หรือรับรองโดย TradingView อ่านเพิ่มเติมที่ ข้อกำหนดการใช้งาน