📈 Price Performance (1 Week)
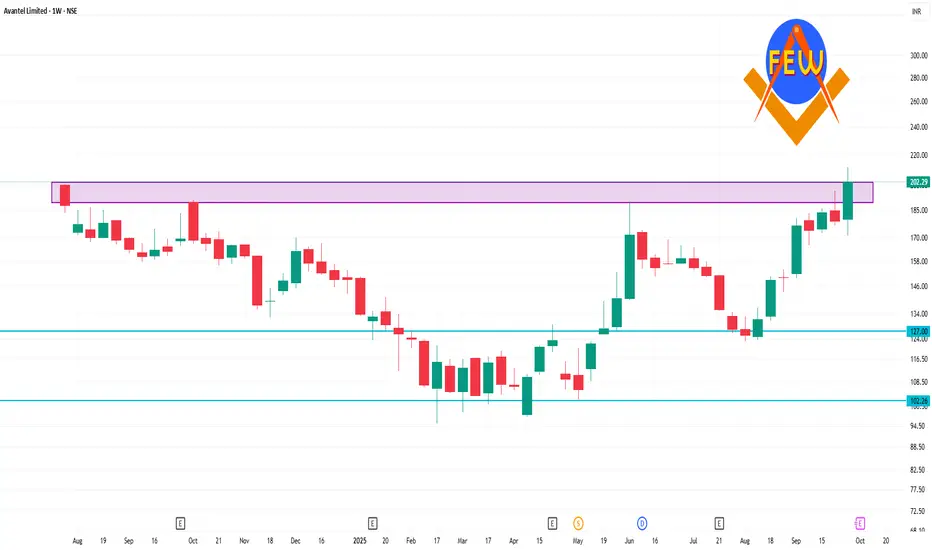
Current Price: ₹202.29
Weekly Change: +11.61%
52-Week Range: ₹95.51 – ₹211.79
📊 Technical Indicators
Moving Averages
20-Day EMA: ₹173.47
50-Day EMA: ₹160.46
100-Day EMA: ₹151.62
200-Day EMA: ₹144.58
Current Price vs. EMAs: The current price is above all major EMAs, indicating a bullish trend.
Relative Strength Index (RSI)
14-Day RSI: 59.26
Interpretation: The RSI is in the neutral zone (50–70), suggesting neither overbought nor oversold conditions.
Moving Average Convergence Divergence (MACD)
MACD Value: 9.44
Signal: Positive MACD indicates upward momentum.
Stochastic RSI
Value: 53.95
Interpretation: Neutral, with no immediate overbought or oversold signals.
🔍 Summary
Trend: Bullish
Indicators: Most technical indicators are aligned with a positive outlook.
Resistance Levels: ₹211.79 (52-week high)
Support Levels: ₹173.47 (20-day EMA)
การนำเสนอที่เกี่ยวข้อง
คำจำกัดสิทธิ์ความรับผิดชอบ
ข้อมูลและบทความไม่ได้มีวัตถุประสงค์เพื่อก่อให้เกิดกิจกรรมทางการเงิน, การลงทุน, การซื้อขาย, ข้อเสนอแนะ หรือคำแนะนำประเภทอื่น ๆ ที่ให้หรือรับรองโดย TradingView อ่านเพิ่มเติมที่ ข้อกำหนดการใช้งาน
การนำเสนอที่เกี่ยวข้อง
คำจำกัดสิทธิ์ความรับผิดชอบ
ข้อมูลและบทความไม่ได้มีวัตถุประสงค์เพื่อก่อให้เกิดกิจกรรมทางการเงิน, การลงทุน, การซื้อขาย, ข้อเสนอแนะ หรือคำแนะนำประเภทอื่น ๆ ที่ให้หรือรับรองโดย TradingView อ่านเพิ่มเติมที่ ข้อกำหนดการใช้งาน