Technical Analysis Overview:
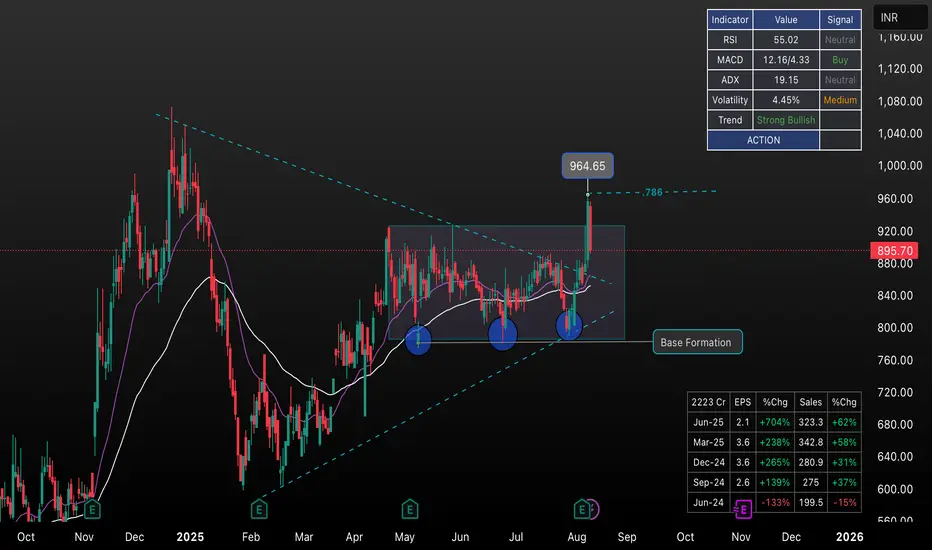
AVALON is currently displaying a classic base formation pattern on the daily chart, which is a bullish continuation signal following the strong uptrend from earlier lows.
Key Observations:
• Current Price: ₹895.70 (as of recent data)
• Pattern: Clean base formation around the ₹780-800 support zone
• Volume: Consolidation phase with declining volume, typical of healthy basing patterns
• Technical Indicators: Strong Buy signal from moving averages (12 buy vs 0 sell signals)
• RSI: 56.04 - indicating bullish momentum without being overbought
Base Formation Analysis: The stock has been consolidating in a tight range after the significant rally, forming what technical analysts call a “flat base pattern”. This is a second-stage consolidation that typically provides another buying opportunity before the next leg up.
Key Levels to Watch:
• Resistance: ₹900-920 zone (recent highs)
• Support: ₹780-800 (base formation low)
• Breakout Target: Above ₹920 could trigger next bullish move
Trading Strategy:
• Entry: On breakout above ₹900-920 with volume confirmation
• Stop Loss: Below ₹780 (base support)
• Target: ₹1000+ based on base depth projection
Risk Management: The tight consolidation range offers an excellent risk-reward ratio for position traders. The narrow base formation suggests strong underlying demand.
Fundamental Backdrop: AVALON Technologies shows strong financial metrics with consistent growth, supporting the technical setup.
Disclaimer: This is for educational purposes only. Always do your own research and manage risk appropriately.
คำจำกัดสิทธิ์ความรับผิดชอบ
ข้อมูลและบทความไม่ได้มีวัตถุประสงค์เพื่อก่อให้เกิดกิจกรรมทางการเงิน, การลงทุน, การซื้อขาย, ข้อเสนอแนะ หรือคำแนะนำประเภทอื่น ๆ ที่ให้หรือรับรองโดย TradingView อ่านเพิ่มเติมที่ ข้อกำหนดการใช้งาน
คำจำกัดสิทธิ์ความรับผิดชอบ
ข้อมูลและบทความไม่ได้มีวัตถุประสงค์เพื่อก่อให้เกิดกิจกรรมทางการเงิน, การลงทุน, การซื้อขาย, ข้อเสนอแนะ หรือคำแนะนำประเภทอื่น ๆ ที่ให้หรือรับรองโดย TradingView อ่านเพิ่มเติมที่ ข้อกำหนดการใช้งาน