📌 1‑Week (Current) Key Levels
📍 Current Price Context
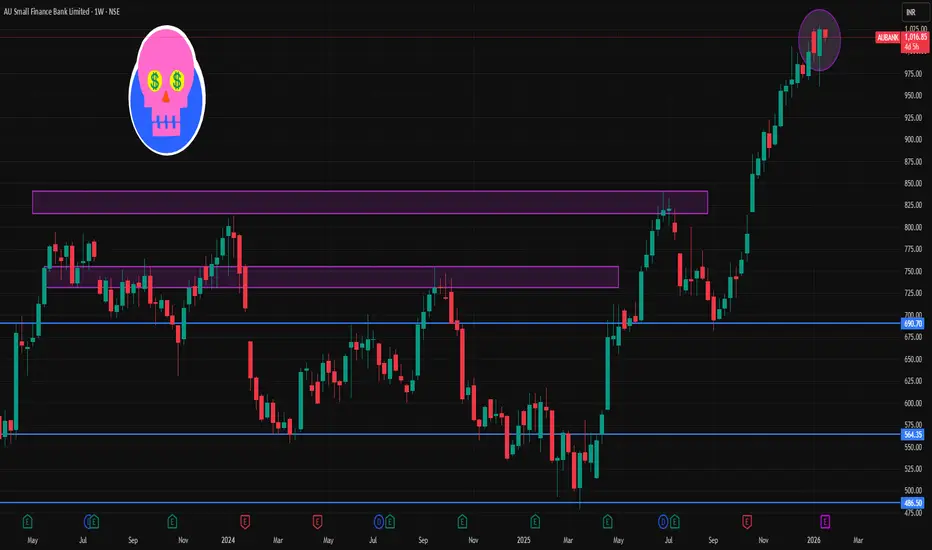
The stock has been trading around ₹1,020–₹1,030 area recently on NSE technical feeds.
🧱 Resistance Levels (Upside Targets)
1. Immediate Resistance (R1): ~₹1,050.35 – first barrier on the upside.
2. Major Resistance (R2): ~₹1,075.30 – next meaningful supply zone.
3. Higher Resistance (R3): ~₹1,120.65 – extended bullish breakout territory.
🛡️ Support Levels (Downside Defenses)
1. Immediate Support (S1): ~₹980.05 – crucial for weekly structure.
2. Major Support (S2): ~₹934.70 – deeper correction zone if S1 breaks.
3. Lower Support (S3): ~₹909.75 – extended bearish support for the week.
📊 Weekly Trading Range Projection
Bearish range: ~₹909–₹980
Bullish range: ~₹1,050–₹1,120 +
Price needs to hold above ₹980 weekly close to maintain bullish bias for the week.
📈 Trend & Indicators (Weekly)
Moving averages and oscillators on short‑term charts show neutral to mildly bullish momentum around ₹1,020–₹1,030.
EMA & SMA structures on daily charts support trend continuation if above key moving averages.
🔎 How to Use These Levels This Week
📌 Bullish setup:
Break and sustain above ~₹1,050 → potential run to ~₹1,075 → ₹1,120.
📌 Bearish setup:
Close below ~₹980 support → target ~₹935 → ₹910 on a deeper correction.
📌 Neutral / Swing range:
Between ₹980 and ₹1,050 → sideways action and range trades.
📍 Current Price Context
The stock has been trading around ₹1,020–₹1,030 area recently on NSE technical feeds.
🧱 Resistance Levels (Upside Targets)
1. Immediate Resistance (R1): ~₹1,050.35 – first barrier on the upside.
2. Major Resistance (R2): ~₹1,075.30 – next meaningful supply zone.
3. Higher Resistance (R3): ~₹1,120.65 – extended bullish breakout territory.
🛡️ Support Levels (Downside Defenses)
1. Immediate Support (S1): ~₹980.05 – crucial for weekly structure.
2. Major Support (S2): ~₹934.70 – deeper correction zone if S1 breaks.
3. Lower Support (S3): ~₹909.75 – extended bearish support for the week.
📊 Weekly Trading Range Projection
Bearish range: ~₹909–₹980
Bullish range: ~₹1,050–₹1,120 +
Price needs to hold above ₹980 weekly close to maintain bullish bias for the week.
📈 Trend & Indicators (Weekly)
Moving averages and oscillators on short‑term charts show neutral to mildly bullish momentum around ₹1,020–₹1,030.
EMA & SMA structures on daily charts support trend continuation if above key moving averages.
🔎 How to Use These Levels This Week
📌 Bullish setup:
Break and sustain above ~₹1,050 → potential run to ~₹1,075 → ₹1,120.
📌 Bearish setup:
Close below ~₹980 support → target ~₹935 → ₹910 on a deeper correction.
📌 Neutral / Swing range:
Between ₹980 and ₹1,050 → sideways action and range trades.
การนำเสนอที่เกี่ยวข้อง
คำจำกัดสิทธิ์ความรับผิดชอบ
ข้อมูลและบทความไม่ได้มีวัตถุประสงค์เพื่อก่อให้เกิดกิจกรรมทางการเงิน, การลงทุน, การซื้อขาย, ข้อเสนอแนะ หรือคำแนะนำประเภทอื่น ๆ ที่ให้หรือรับรองโดย TradingView อ่านเพิ่มเติมใน ข้อกำหนดการใช้งาน
การนำเสนอที่เกี่ยวข้อง
คำจำกัดสิทธิ์ความรับผิดชอบ
ข้อมูลและบทความไม่ได้มีวัตถุประสงค์เพื่อก่อให้เกิดกิจกรรมทางการเงิน, การลงทุน, การซื้อขาย, ข้อเสนอแนะ หรือคำแนะนำประเภทอื่น ๆ ที่ให้หรือรับรองโดย TradingView อ่านเพิ่มเติมใน ข้อกำหนดการใช้งาน