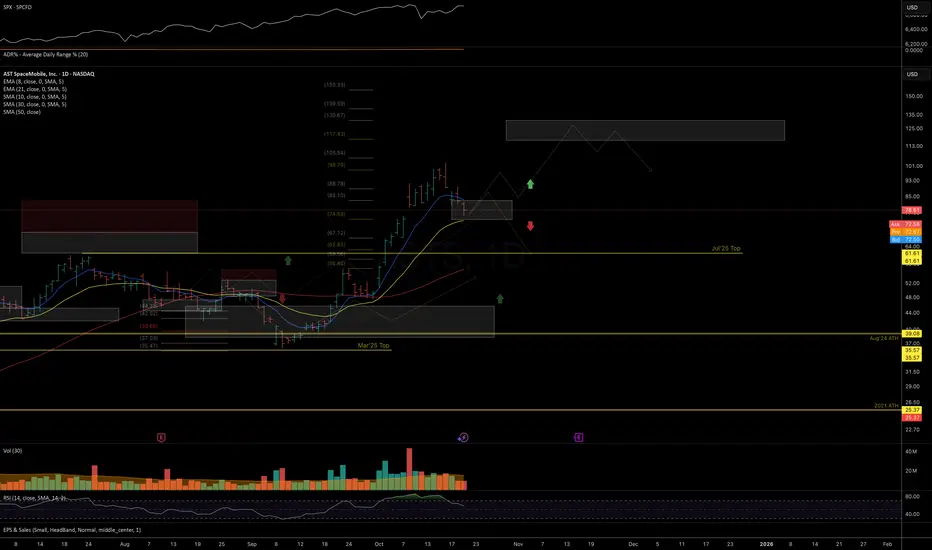
Price has followed through with the upside potential outlined in the September update and has come close to resistance zone (115–130), where at least a mid-term top formation might be expected.
With momentum leaders losing strength recently, price could already be forming the first leg down within a larger degree topping structure. However, as long as price remains above 74 and the 21dEMA, the potential for a direct test of the macro resistance zone cannot be ruled out.
A break below 74 and the 21dEMA would likely confirm the top and increase the odds of a deeper pullback toward July highs and lower levels.
Chart:

Previously:
• On upside potential (Sep 22):
Chart:
https://www.tradingview.com/symbols/NASDAQ-ASTS/minds/?mind=gwLV4UKTSC2aqdPIkUYXDg
• On bottoming action potential (Sep 9):
Chart:
https://www.tradingview.com/symbols/NASDAQ-ASTS/minds/?mind=GLayLldxSCiQAB5cLOO0Cg
• On resistance (Aug 25):
Chart:
https://www.tradingview.com/symbols/NASDAQ-ASTS/minds/?mind=sdIGVez8SiW63op10mPaMg
• On mid-term support (Aug 18):
Chart:
https://www.tradingview.com/symbols/NASDAQ-ASTS/minds/?mind=fIq5oL8RSa2nZapAMgi7xQ
• On bounce setup (Aug 7):
Chart:
https://www.tradingview.com/symbols/NASDAQ-ASTS/minds/?mind=xe5IZbdcQgiRwPezmSua-Q
• On mid-term resistance (Jul 21):
Chart:
https://www.tradingview.com/symbols/NASDAQ-ASTS/minds/?mind=yFfB_9CTT0qPqLGRKQVPpw
With momentum leaders losing strength recently, price could already be forming the first leg down within a larger degree topping structure. However, as long as price remains above 74 and the 21dEMA, the potential for a direct test of the macro resistance zone cannot be ruled out.
A break below 74 and the 21dEMA would likely confirm the top and increase the odds of a deeper pullback toward July highs and lower levels.
Chart:
Previously:
• On upside potential (Sep 22):
Chart:
https://www.tradingview.com/symbols/NASDAQ-ASTS/minds/?mind=gwLV4UKTSC2aqdPIkUYXDg
• On bottoming action potential (Sep 9):
Chart:
https://www.tradingview.com/symbols/NASDAQ-ASTS/minds/?mind=GLayLldxSCiQAB5cLOO0Cg
• On resistance (Aug 25):
Chart:
https://www.tradingview.com/symbols/NASDAQ-ASTS/minds/?mind=sdIGVez8SiW63op10mPaMg
• On mid-term support (Aug 18):
Chart:
https://www.tradingview.com/symbols/NASDAQ-ASTS/minds/?mind=fIq5oL8RSa2nZapAMgi7xQ
• On bounce setup (Aug 7):
Chart:
https://www.tradingview.com/symbols/NASDAQ-ASTS/minds/?mind=xe5IZbdcQgiRwPezmSua-Q
• On mid-term resistance (Jul 21):
Chart:
https://www.tradingview.com/symbols/NASDAQ-ASTS/minds/?mind=yFfB_9CTT0qPqLGRKQVPpw
📊 Daily FREE Market Insights | Crypto + US Stocks
⚡ Technical analysis, setups & commentary
🌍 t.me/MarketArtistryENG | 🇷🇺 t.me/marketartistry
Join and let's grow together! 🚀
⚡ Technical analysis, setups & commentary
🌍 t.me/MarketArtistryENG | 🇷🇺 t.me/marketartistry
Join and let's grow together! 🚀
คำจำกัดสิทธิ์ความรับผิดชอบ
ข้อมูลและบทความไม่ได้มีวัตถุประสงค์เพื่อก่อให้เกิดกิจกรรมทางการเงิน, การลงทุน, การซื้อขาย, ข้อเสนอแนะ หรือคำแนะนำประเภทอื่น ๆ ที่ให้หรือรับรองโดย TradingView อ่านเพิ่มเติมที่ ข้อกำหนดการใช้งาน