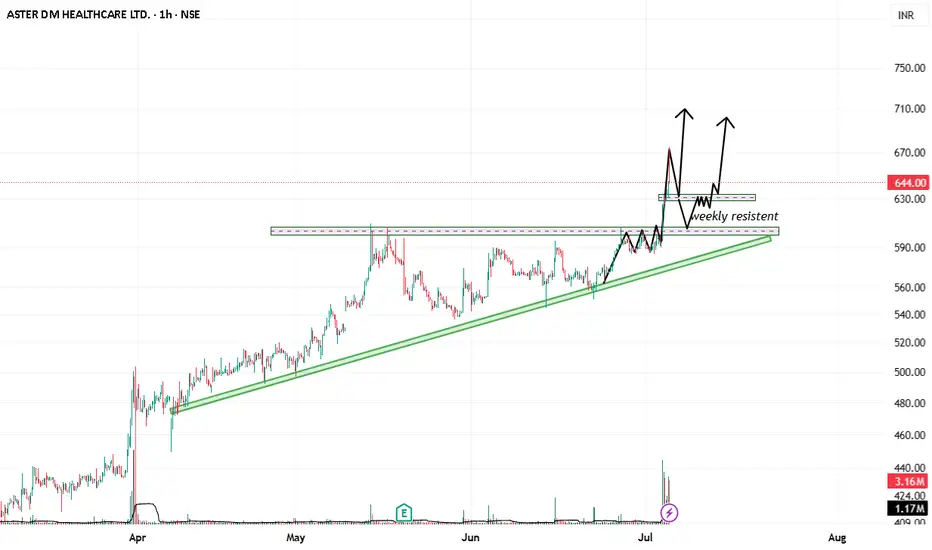
Trend and Structure:
The chart shows a clear ascending trendline (marked in green), supporting higher lows from May through early July.
Price recently broke out strongly above a horizontal resistance zone around 600-620 INR, which acted as a weekly resistance.
Volume spiked during the breakout, confirming buying interest.
Support and Resistance:
The previous resistance zone (~600-620 INR) has now turned into a support zone (labeled as "weekly resistant" on the chart).
The ascending trendline also offers a lower support around 580-590 INR.
Immediate resistance post-breakout is not clearly marked but could be tested in the 680-720 INR zone based on price moves and arrows on the chart.
Price Projections:
The arrows indicate an expected pullback to the breakout zone (~620), followed by a bounce.
This suggests a classic retest of support after a breakout, a common bullish sign.
Volume:
Volume is high during the breakout, supporting the surge.
Watch for volume consistency on the retest to validate support strength.
Trading plan:
Entry:
Consider entering a long position on a confirmed pullback/retest of the breakout zone around 620-630 INR.
Confirmation could be a bullish candlestick pattern or bounce off support.
Stop Loss:
Place a stop loss just below the weekly resistance turned support zone or below the ascending trendline, around 590-600 INR, to manage risk.
Targets:
First target can be near recent highs at ~680 INR.
Second target may be near the next resistance zone around 720 INR.
Risk-Reward:
Risk: Approx. 20-30 INR per share (stop loss zone)
Reward: Potential gain of 50-80 INR per share
Risk-reward ratio of approximately 2:1 or better.
Additional Notes:
If the price fails to hold above 620 INR and dips below the ascending trendline, reconsider the trade and wait for a clearer setup.
Monitor volume during the retest; strong volume on the bounce confirms the move.
The trade aligns with the prevailing uptrend and breakout confirmation principles.
คำจำกัดสิทธิ์ความรับผิดชอบ
ข้อมูลและบทความไม่ได้มีวัตถุประสงค์เพื่อก่อให้เกิดกิจกรรมทางการเงิน, การลงทุน, การซื้อขาย, ข้อเสนอแนะ หรือคำแนะนำประเภทอื่น ๆ ที่ให้หรือรับรองโดย TradingView อ่านเพิ่มเติมที่ ข้อกำหนดการใช้งาน
คำจำกัดสิทธิ์ความรับผิดชอบ
ข้อมูลและบทความไม่ได้มีวัตถุประสงค์เพื่อก่อให้เกิดกิจกรรมทางการเงิน, การลงทุน, การซื้อขาย, ข้อเสนอแนะ หรือคำแนะนำประเภทอื่น ๆ ที่ให้หรือรับรองโดย TradingView อ่านเพิ่มเติมที่ ข้อกำหนดการใช้งาน