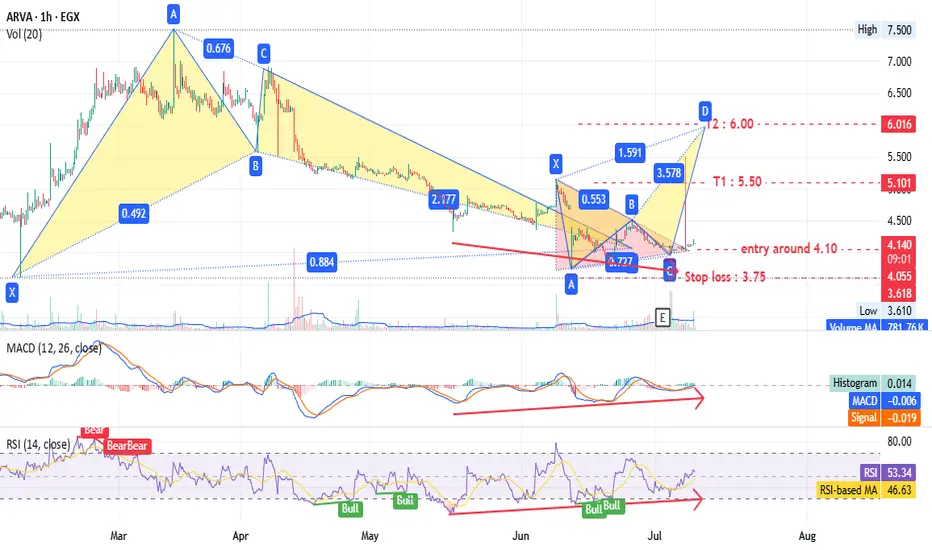
Entry around 4.10
Stop loss at 3.75 (10% loss).
Targets at 5.50 and 6.00 (up to 44% profit).
Hourly chart shows a triangle pattern and bearish Gartley pattern.
Daily timeframe also indicates a bullish pattern with the same targets.
MACD and RSI support this analysis.
Note: This is not investment advice—only my analysis based on chart data. Consult your account manager before investing. Good luck!
ปิดการเทรด: ถึงเป้าหมายการทำกำไร
คำจำกัดสิทธิ์ความรับผิดชอบ
ข้อมูลและบทความไม่ได้มีวัตถุประสงค์เพื่อก่อให้เกิดกิจกรรมทางการเงิน, การลงทุน, การซื้อขาย, ข้อเสนอแนะ หรือคำแนะนำประเภทอื่น ๆ ที่ให้หรือรับรองโดย TradingView อ่านเพิ่มเติมที่ ข้อกำหนดการใช้งาน
คำจำกัดสิทธิ์ความรับผิดชอบ
ข้อมูลและบทความไม่ได้มีวัตถุประสงค์เพื่อก่อให้เกิดกิจกรรมทางการเงิน, การลงทุน, การซื้อขาย, ข้อเสนอแนะ หรือคำแนะนำประเภทอื่น ๆ ที่ให้หรือรับรองโดย TradingView อ่านเพิ่มเติมที่ ข้อกำหนดการใช้งาน