Hello
I want to make it simpler for those traders who are not sure about this symbol.
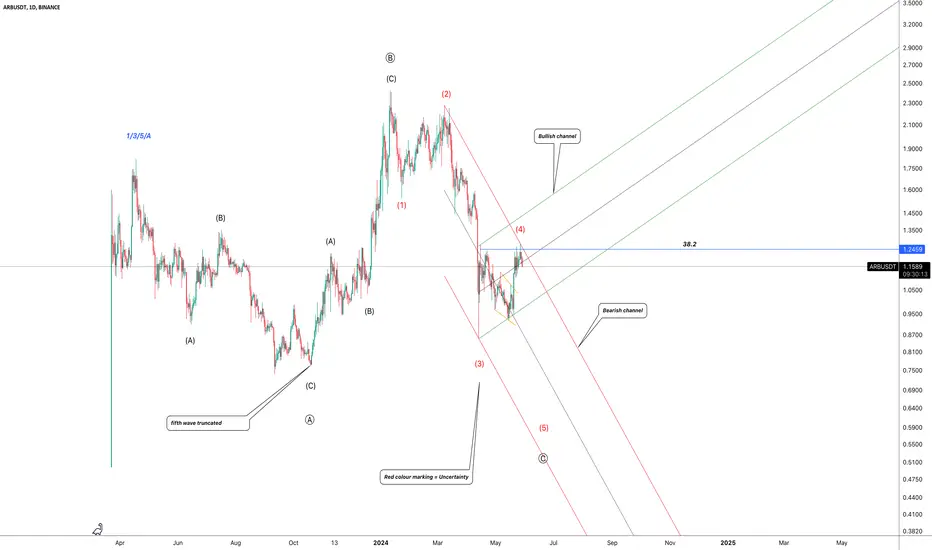
If ARB drops down along side this red boundaries, we can see last bearish fifth wave , but if ARB wants to reverse, so it should break out green channel with strong movements.
Just sit and see for now
Thanks
I want to make it simpler for those traders who are not sure about this symbol.
If ARB drops down along side this red boundaries, we can see last bearish fifth wave , but if ARB wants to reverse, so it should break out green channel with strong movements.
Just sit and see for now
Thanks
บันทึก
Everything depends on our blue 38.2 Fibo level( static resistance ) with 1.2459 USD price.บันทึก
How deep will wave (5) correct, you think?คำจำกัดสิทธิ์ความรับผิดชอบ
ข้อมูลและบทความไม่ได้มีวัตถุประสงค์เพื่อก่อให้เกิดกิจกรรมทางการเงิน, การลงทุน, การซื้อขาย, ข้อเสนอแนะ หรือคำแนะนำประเภทอื่น ๆ ที่ให้หรือรับรองโดย TradingView อ่านเพิ่มเติมใน ข้อกำหนดการใช้งาน
คำจำกัดสิทธิ์ความรับผิดชอบ
ข้อมูลและบทความไม่ได้มีวัตถุประสงค์เพื่อก่อให้เกิดกิจกรรมทางการเงิน, การลงทุน, การซื้อขาย, ข้อเสนอแนะ หรือคำแนะนำประเภทอื่น ๆ ที่ให้หรือรับรองโดย TradingView อ่านเพิ่มเติมใน ข้อกำหนดการใช้งาน