Amazon  AMZN has been in an upward-sloping trend since early April, but the e-commerce giant is trailing the S&P 500
  SPX year to date and has fallen some 4% since its February all-time peak. Let's look at what the stock's chart says.
Amazon and the Macro Environment
Many would find it difficult to take on a short position or liquidate a long one on a major tech stock like Amazon just as Wall Street expects the Federal Reserve to pivot toward a significantly more-dovish policy stance.
But remember, Amazon is more than just a tech stock. It's also a major online retailer, the owner of a high-end brick-and-mortar grocer (Whole Foods), parent of a major consumer-discretionary product (Amazon Prime Video) and more.
Would it be as difficult to take a short position or liquidate a long one in such a name as the Fed goes into a dovish stance amid a U.S. labor market that's markedly weaker than anyone knew?
After the U.S. Bureau of Labor Statistics recently issued as massive downward annual to its Apil 2024/March 2025 job-creation numbers, Chief Bloomberg U.S. Economist Anna Wong argued that America could already be in a recession.
"When all the revisions for 2024 and 2025 are complete -- we won't get the final revisions until early 2026 and 2027 -- we expect they'll show the business cycle peaked around April 2024," she said.
"It's possible the economy is either still in recession, or is in the early phase of a new business cycle," said Wong, who formerly served as principal economist for the Federal Reserve Board.
It's not every day that a highly respected economist talks about backdating a recession by a year and half. That would be potentially bad news for a consumer-focused company like Amazon.
Amazon's Technical Analysis
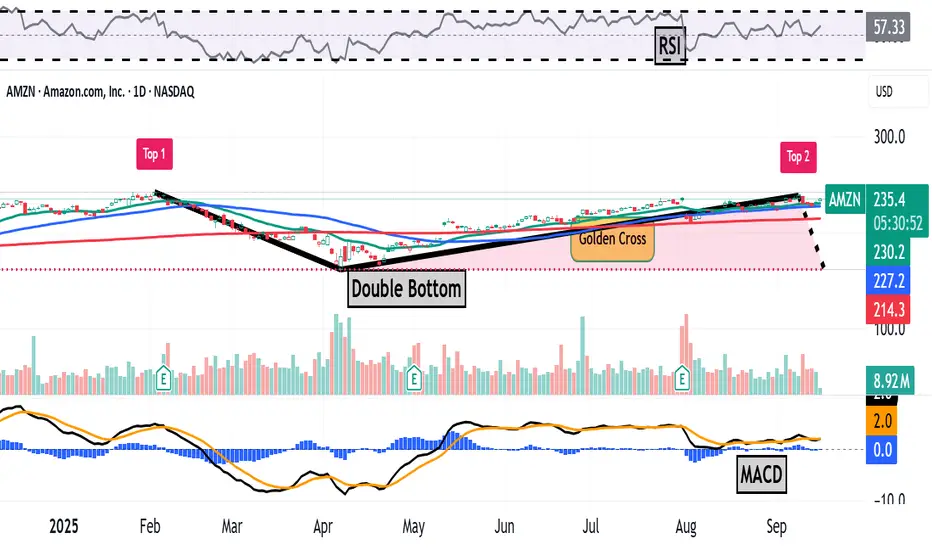
Now let's look at Amazon's year-to-date chart as of Wednesday:

There are two patterns under development, both potentially bearish.
Readers will first note the potential development of a very large "double-top" pattern of bearish reversal, marked with two red boxes in the chart above.
This pattern's downside pivot would be way down at $161 vs. the $232.54 that AMZN was trading at Tuesday morning.
That would be a long way to go just to reach a pivot, and would also put a so-called "double-bottom" pattern into play.
Meanwhile, Amazon's chart also shows another potentially bearish set-up in the works with a more realistic pivot:

This chart shows an almost-completed "rising-wedge" pattern of bearish reversal with a realistic downside pivot that just happens to be Amazon's 50-day Simple Moving Average (or "SMA," marked with a blue line above).
Th 50-day SMA line is currently running alongside the rising-wedge pattern's power trendline. Amazon is also seeing potential support at its 200-day SMA (the red line above) as well.
However, the chart above shows what happened the last time AMZN came out of a rising wedge this past February, as marked with a purple-shaded area at the chart's left.
The stock fell nearly 30% from about $225 during February's third week to a $161.38 52-week low on April 7.
Meanwhile, Amazon's other technical indicators in the above chart don't tell us much just yet.
For instance, the stock's Relative Strength Index (the gray line at the chart's top) is still better than neutral, but sliding towards mediocrity.
Separately, AMZNs daily Moving Average Convergence Divergence indicator (or "MACD," marked with black and gold lines and blue bars at the chart's bottom) is still technically postured bullishly -- but has some issues.
The histogram of Amazon's 9-day Exponential Moving Average (or "EMA," marked with blue bars) is still positive, but the 12-day EMA (the black line) is curling down towards the 26-day EMA (the gold line). A cross-under there would be a short- to medium-term bearish signal for the stock.
(Moomoo Technologies Inc. Markets Commentator Stephen “Sarge” Guilfoyle had no position in AMZN at the time of writing this column.)
This article discusses technical analysis, other approaches, including fundamental analysis, may offer very different views. The examples provided are for illustrative purposes only and are not intended to be reflective of the results you can expect to achieve. Specific security charts used are for illustrative purposes only and are not a recommendation, offer to sell, or a solicitation of an offer to buy any security. Past investment performance does not indicate or guarantee future success. Returns will vary, and all investments carry risks, including loss of principal. This content is also not a research report and is not intended to serve as the basis for any investment decision. The information contained in this article does not purport to be a complete description of the securities, markets, or developments referred to in this material. Moomoo and its affiliates make no representation or warranty as to the article's adequacy, completeness, accuracy or timeliness for any particular purpose of the above content. Furthermore, there is no guarantee that any statements, estimates, price targets, opinions or forecasts provided herein will prove to be correct.
Moomoo is a financial information and trading app offered by Moomoo Technologies Inc. In the U.S., investment products and services on Moomoo are offered by Moomoo Financial Inc., Member FINRA/SIPC.
TradingView is an independent third party not affiliated with Moomoo Financial Inc., Moomoo Technologies Inc., or its affiliates. Moomoo Financial Inc. and its affiliates do not endorse, represent or warrant the completeness and accuracy of the data and information available on the TradingView platform and are not responsible for any services provided by the third-party platform.
Amazon and the Macro Environment
Many would find it difficult to take on a short position or liquidate a long one on a major tech stock like Amazon just as Wall Street expects the Federal Reserve to pivot toward a significantly more-dovish policy stance.
But remember, Amazon is more than just a tech stock. It's also a major online retailer, the owner of a high-end brick-and-mortar grocer (Whole Foods), parent of a major consumer-discretionary product (Amazon Prime Video) and more.
Would it be as difficult to take a short position or liquidate a long one in such a name as the Fed goes into a dovish stance amid a U.S. labor market that's markedly weaker than anyone knew?
After the U.S. Bureau of Labor Statistics recently issued as massive downward annual to its Apil 2024/March 2025 job-creation numbers, Chief Bloomberg U.S. Economist Anna Wong argued that America could already be in a recession.
"When all the revisions for 2024 and 2025 are complete -- we won't get the final revisions until early 2026 and 2027 -- we expect they'll show the business cycle peaked around April 2024," she said.
"It's possible the economy is either still in recession, or is in the early phase of a new business cycle," said Wong, who formerly served as principal economist for the Federal Reserve Board.
It's not every day that a highly respected economist talks about backdating a recession by a year and half. That would be potentially bad news for a consumer-focused company like Amazon.
Amazon's Technical Analysis
Now let's look at Amazon's year-to-date chart as of Wednesday:
There are two patterns under development, both potentially bearish.
Readers will first note the potential development of a very large "double-top" pattern of bearish reversal, marked with two red boxes in the chart above.
This pattern's downside pivot would be way down at $161 vs. the $232.54 that AMZN was trading at Tuesday morning.
That would be a long way to go just to reach a pivot, and would also put a so-called "double-bottom" pattern into play.
Meanwhile, Amazon's chart also shows another potentially bearish set-up in the works with a more realistic pivot:
This chart shows an almost-completed "rising-wedge" pattern of bearish reversal with a realistic downside pivot that just happens to be Amazon's 50-day Simple Moving Average (or "SMA," marked with a blue line above).
Th 50-day SMA line is currently running alongside the rising-wedge pattern's power trendline. Amazon is also seeing potential support at its 200-day SMA (the red line above) as well.
However, the chart above shows what happened the last time AMZN came out of a rising wedge this past February, as marked with a purple-shaded area at the chart's left.
The stock fell nearly 30% from about $225 during February's third week to a $161.38 52-week low on April 7.
Meanwhile, Amazon's other technical indicators in the above chart don't tell us much just yet.
For instance, the stock's Relative Strength Index (the gray line at the chart's top) is still better than neutral, but sliding towards mediocrity.
Separately, AMZNs daily Moving Average Convergence Divergence indicator (or "MACD," marked with black and gold lines and blue bars at the chart's bottom) is still technically postured bullishly -- but has some issues.
The histogram of Amazon's 9-day Exponential Moving Average (or "EMA," marked with blue bars) is still positive, but the 12-day EMA (the black line) is curling down towards the 26-day EMA (the gold line). A cross-under there would be a short- to medium-term bearish signal for the stock.
(Moomoo Technologies Inc. Markets Commentator Stephen “Sarge” Guilfoyle had no position in AMZN at the time of writing this column.)
This article discusses technical analysis, other approaches, including fundamental analysis, may offer very different views. The examples provided are for illustrative purposes only and are not intended to be reflective of the results you can expect to achieve. Specific security charts used are for illustrative purposes only and are not a recommendation, offer to sell, or a solicitation of an offer to buy any security. Past investment performance does not indicate or guarantee future success. Returns will vary, and all investments carry risks, including loss of principal. This content is also not a research report and is not intended to serve as the basis for any investment decision. The information contained in this article does not purport to be a complete description of the securities, markets, or developments referred to in this material. Moomoo and its affiliates make no representation or warranty as to the article's adequacy, completeness, accuracy or timeliness for any particular purpose of the above content. Furthermore, there is no guarantee that any statements, estimates, price targets, opinions or forecasts provided herein will prove to be correct.
Moomoo is a financial information and trading app offered by Moomoo Technologies Inc. In the U.S., investment products and services on Moomoo are offered by Moomoo Financial Inc., Member FINRA/SIPC.
TradingView is an independent third party not affiliated with Moomoo Financial Inc., Moomoo Technologies Inc., or its affiliates. Moomoo Financial Inc. and its affiliates do not endorse, represent or warrant the completeness and accuracy of the data and information available on the TradingView platform and are not responsible for any services provided by the third-party platform.
คำจำกัดสิทธิ์ความรับผิดชอบ
ข้อมูลและบทความไม่ได้มีวัตถุประสงค์เพื่อก่อให้เกิดกิจกรรมทางการเงิน, การลงทุน, การซื้อขาย, ข้อเสนอแนะ หรือคำแนะนำประเภทอื่น ๆ ที่ให้หรือรับรองโดย TradingView อ่านเพิ่มเติมที่ ข้อกำหนดการใช้งาน
คำจำกัดสิทธิ์ความรับผิดชอบ
ข้อมูลและบทความไม่ได้มีวัตถุประสงค์เพื่อก่อให้เกิดกิจกรรมทางการเงิน, การลงทุน, การซื้อขาย, ข้อเสนอแนะ หรือคำแนะนำประเภทอื่น ๆ ที่ให้หรือรับรองโดย TradingView อ่านเพิ่มเติมที่ ข้อกำหนดการใช้งาน