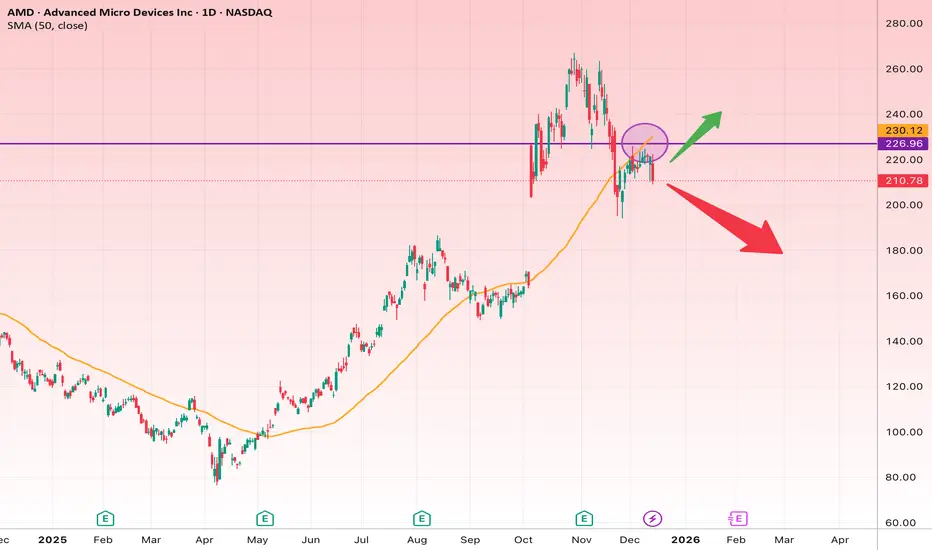
After a strong bullish impulse, AMD has entered a corrective phase and is currently trading below the 50-day SMA (around 230) and under a key horizontal resistance zone at 226–230.
The circled area highlights a clear rejection from resistance combined with the SMA, making this zone critical for the next directional move.
Bullish Scenario
If price achieves a daily close above 230:
Targets
• Target 1: 245
• Target 2: 260
• Target 3: 275–280
Stop Loss
• Daily close below 218
Rationale:
Breakout above a major resistance and reclaiming the 50 SMA would signal trend continuation and renewed bullish momentum.
Bearish Scenario
If price loses the 205–210 support zone:
Targets
• Target 1: 195
• Target 2: 180
• Target 3: 165
Stop Loss
• Reclaim and daily close above 225
Rationale:
Repeated rejection from resistance, weakening momentum, and a deeper correction following an extended rally.
Very Short Summary
Above 230 → Bullish continuation
Below 210 → Deeper correction likely
คำจำกัดสิทธิ์ความรับผิดชอบ
ข้อมูลและบทความไม่ได้มีวัตถุประสงค์เพื่อก่อให้เกิดกิจกรรมทางการเงิน, การลงทุน, การซื้อขาย, ข้อเสนอแนะ หรือคำแนะนำประเภทอื่น ๆ ที่ให้หรือรับรองโดย TradingView อ่านเพิ่มเติมใน ข้อกำหนดการใช้งาน
คำจำกัดสิทธิ์ความรับผิดชอบ
ข้อมูลและบทความไม่ได้มีวัตถุประสงค์เพื่อก่อให้เกิดกิจกรรมทางการเงิน, การลงทุน, การซื้อขาย, ข้อเสนอแนะ หรือคำแนะนำประเภทอื่น ๆ ที่ให้หรือรับรองโดย TradingView อ่านเพิ่มเติมใน ข้อกำหนดการใช้งาน