Hello traders 🐺
let's start with the daily chart :

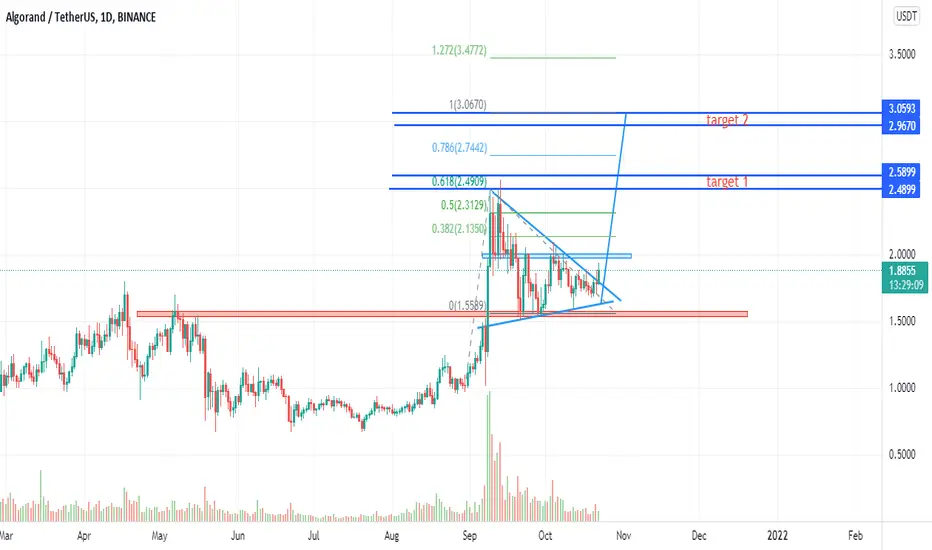
in the daily chart , ALGO formed a triangle pattern , also you can count this as bull flag pattern , no matter how you imagine this price pattern , it's important to learn how we can trade based on this patterns 🤔 .
let's count this as bull flag , you can clearly see during the pattern , volume start to comes down , this is one of the important signs that you must known about the volume , usually during the pattern like picture above , volume comes down and at the break out point we must notice to the volume , because at that point volume must be higher than previous candles ;
but about ALGO , we cant see huge volume at the point of the break out , but it's not mean it isn't a legitimate break out , it means there is chance for bear to create a bull trap , or in other words it could turn into the fake out .
personally prefer to wait for the retest the triangle resistance line or wait for the clear break out from the daily resistance structure ( blue box )
but what is the potential price targets for ALGO🚀 :
the technical target of the FLAG pattern , calculate like below picture :

but I like to use Fibonacci levels to find best points for take profit :

by using the Fibonacci projection we can calculate the price targets ; you can see the 1.0 Fibonacci levels is in alignment with the bull flag pattern , but more importantly the 0.618 is exactly at the previous high , so this is very strong resistance area .
🐺I hope you enjoyed this analysis.
Do not forget to like and subscribe
share my ideas with your friends , thanks for watching my ideas🐺
let's start with the daily chart :
in the daily chart , ALGO formed a triangle pattern , also you can count this as bull flag pattern , no matter how you imagine this price pattern , it's important to learn how we can trade based on this patterns 🤔 .
let's count this as bull flag , you can clearly see during the pattern , volume start to comes down , this is one of the important signs that you must known about the volume , usually during the pattern like picture above , volume comes down and at the break out point we must notice to the volume , because at that point volume must be higher than previous candles ;
but about ALGO , we cant see huge volume at the point of the break out , but it's not mean it isn't a legitimate break out , it means there is chance for bear to create a bull trap , or in other words it could turn into the fake out .
personally prefer to wait for the retest the triangle resistance line or wait for the clear break out from the daily resistance structure ( blue box )
but what is the potential price targets for ALGO🚀 :
the technical target of the FLAG pattern , calculate like below picture :
but I like to use Fibonacci levels to find best points for take profit :
by using the Fibonacci projection we can calculate the price targets ; you can see the 1.0 Fibonacci levels is in alignment with the bull flag pattern , but more importantly the 0.618 is exactly at the previous high , so this is very strong resistance area .
🐺I hope you enjoyed this analysis.
Do not forget to like and subscribe
share my ideas with your friends , thanks for watching my ideas🐺
_____________________________________
🐺 Discipline is rarely enjoyable ,
But almost always profitable 🐺
TElEGRAM CHANNEL : t.me/KIU_COIN
_____________________________________
🐺 Discipline is rarely enjoyable ,
But almost always profitable 🐺
TElEGRAM CHANNEL : t.me/KIU_COIN
_____________________________________
คำจำกัดสิทธิ์ความรับผิดชอบ
ข้อมูลและบทความไม่ได้มีวัตถุประสงค์เพื่อก่อให้เกิดกิจกรรมทางการเงิน, การลงทุน, การซื้อขาย, ข้อเสนอแนะ หรือคำแนะนำประเภทอื่น ๆ ที่ให้หรือรับรองโดย TradingView อ่านเพิ่มเติมที่ ข้อกำหนดการใช้งาน
_____________________________________
🐺 Discipline is rarely enjoyable ,
But almost always profitable 🐺
TElEGRAM CHANNEL : t.me/KIU_COIN
_____________________________________
🐺 Discipline is rarely enjoyable ,
But almost always profitable 🐺
TElEGRAM CHANNEL : t.me/KIU_COIN
_____________________________________
คำจำกัดสิทธิ์ความรับผิดชอบ
ข้อมูลและบทความไม่ได้มีวัตถุประสงค์เพื่อก่อให้เกิดกิจกรรมทางการเงิน, การลงทุน, การซื้อขาย, ข้อเสนอแนะ หรือคำแนะนำประเภทอื่น ๆ ที่ให้หรือรับรองโดย TradingView อ่านเพิ่มเติมที่ ข้อกำหนดการใช้งาน