Stock Analysis - step by step for Algoquant Fintech Ltd.
Chart & Price Action Analysis (Weekly Chart)-:
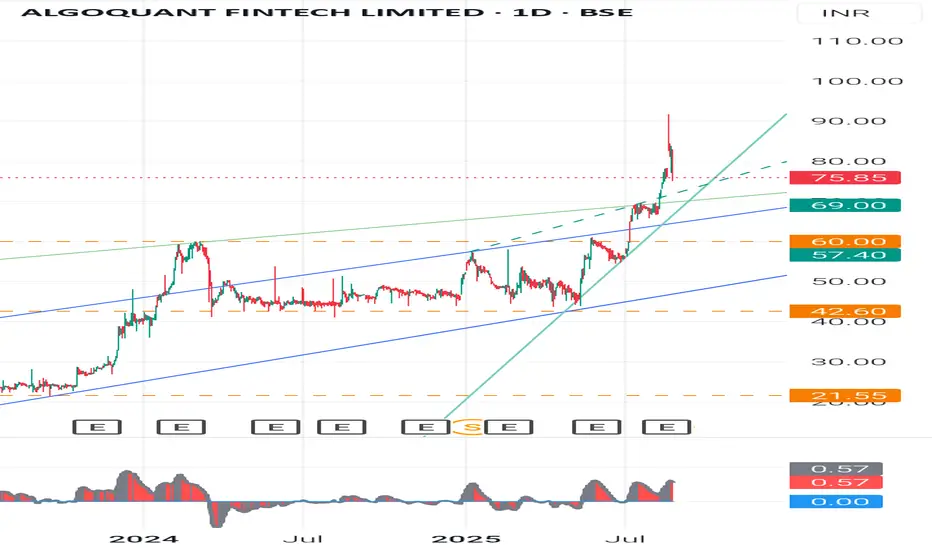
-Current Price: 78.95 (-3.84%)
+Recent Move: Stock gave a strong breakout above its long consolidation channel ( 42- 69).
-Candlestick: The latest candle is a long wick candle after a strong breakout - This signals profit booking after a sharp rally.
- Support Levels
69 - Recent breakout retest zone
60 - Strong support from previous swing highs
42.6 - Major base support (long-term)
- Resistance Levels
85- 88 - Immediate resistance (due to long upper wick supply)
100+ - Psychological round level
120 - Next major target if momentum sustains
🕯️ Candlestick & Swing Analysis
Pattern: Breakout candle with long wick - suggests short-term profit booking, but trend remains positive.
Swing Trend: Stock formed higher highs & higher lows since mid-2023, a sign of strong uptrend.
Risk: If it falls below 69 on weekly closing, trend may weaken.
- Fundamental Comparison (with Fintech peers like Infibeam Avenues, IndiaMart, and small fintech players)
Metric Algoquant Fintech Infibeam Avenues IndiaMart Intermesh
P/E Ratio Very High (Loss-making / low EPS stage) -38x -45x
Revenue Growth Very high (small base effect) Moderate Stable
Debt Low Low Very Low
Business Stage Emerging (High growth, high risk) Mid-sized, stable Established, B2B stronghold
👉 Learning: Algoquant is in an early stage compared to peers - higher growth potential but also higher risk.
📘 Basic Learnings for Students (Investment Education)
1. Candlestick Learning - Long upper wicks after breakout = profit booking - watch for retest of breakout levels.
2. Swing Analysis - Trend is up as long as higher highs-higher lows structure is maintained.
3. Chart Pattern - Breakout from long channel = momentum can continue if volumes sustain.
4. Fundamental Insight - Always compare with industry peers on P/E, revenue growth, debt, margins.
5. Risk Management - In emerging companies, volatility is high. Always keep a stop-loss.
⚠️ Disclaimer
This analysis is for educational purposes only. It is not investment advice. Stock markets are subject to risks. Please do your own research (DYOR) or consult a SEBI-registered advisor before investing.
#Algoquant #FintechStocks #StockMarketIndia #TechnicalAnalysis #CandlestickPatterns #SwingTrading #InvestingForBeginners #FundamentalAnalysis #StockMarketEducation #DYOR
Chart & Price Action Analysis (Weekly Chart)-:
-Current Price: 78.95 (-3.84%)
+Recent Move: Stock gave a strong breakout above its long consolidation channel ( 42- 69).
-Candlestick: The latest candle is a long wick candle after a strong breakout - This signals profit booking after a sharp rally.
- Support Levels
69 - Recent breakout retest zone
60 - Strong support from previous swing highs
42.6 - Major base support (long-term)
- Resistance Levels
85- 88 - Immediate resistance (due to long upper wick supply)
100+ - Psychological round level
120 - Next major target if momentum sustains
🕯️ Candlestick & Swing Analysis
Pattern: Breakout candle with long wick - suggests short-term profit booking, but trend remains positive.
Swing Trend: Stock formed higher highs & higher lows since mid-2023, a sign of strong uptrend.
Risk: If it falls below 69 on weekly closing, trend may weaken.
- Fundamental Comparison (with Fintech peers like Infibeam Avenues, IndiaMart, and small fintech players)
Metric Algoquant Fintech Infibeam Avenues IndiaMart Intermesh
P/E Ratio Very High (Loss-making / low EPS stage) -38x -45x
Revenue Growth Very high (small base effect) Moderate Stable
Debt Low Low Very Low
Business Stage Emerging (High growth, high risk) Mid-sized, stable Established, B2B stronghold
👉 Learning: Algoquant is in an early stage compared to peers - higher growth potential but also higher risk.
📘 Basic Learnings for Students (Investment Education)
1. Candlestick Learning - Long upper wicks after breakout = profit booking - watch for retest of breakout levels.
2. Swing Analysis - Trend is up as long as higher highs-higher lows structure is maintained.
3. Chart Pattern - Breakout from long channel = momentum can continue if volumes sustain.
4. Fundamental Insight - Always compare with industry peers on P/E, revenue growth, debt, margins.
5. Risk Management - In emerging companies, volatility is high. Always keep a stop-loss.
⚠️ Disclaimer
This analysis is for educational purposes only. It is not investment advice. Stock markets are subject to risks. Please do your own research (DYOR) or consult a SEBI-registered advisor before investing.
#Algoquant #FintechStocks #StockMarketIndia #TechnicalAnalysis #CandlestickPatterns #SwingTrading #InvestingForBeginners #FundamentalAnalysis #StockMarketEducation #DYOR
การนำเสนอที่เกี่ยวข้อง
คำจำกัดสิทธิ์ความรับผิดชอบ
ข้อมูลและบทความไม่ได้มีวัตถุประสงค์เพื่อก่อให้เกิดกิจกรรมทางการเงิน, การลงทุน, การซื้อขาย, ข้อเสนอแนะ หรือคำแนะนำประเภทอื่น ๆ ที่ให้หรือรับรองโดย TradingView อ่านเพิ่มเติมที่ ข้อกำหนดการใช้งาน
การนำเสนอที่เกี่ยวข้อง
คำจำกัดสิทธิ์ความรับผิดชอบ
ข้อมูลและบทความไม่ได้มีวัตถุประสงค์เพื่อก่อให้เกิดกิจกรรมทางการเงิน, การลงทุน, การซื้อขาย, ข้อเสนอแนะ หรือคำแนะนำประเภทอื่น ๆ ที่ให้หรือรับรองโดย TradingView อ่านเพิ่มเติมที่ ข้อกำหนดการใช้งาน