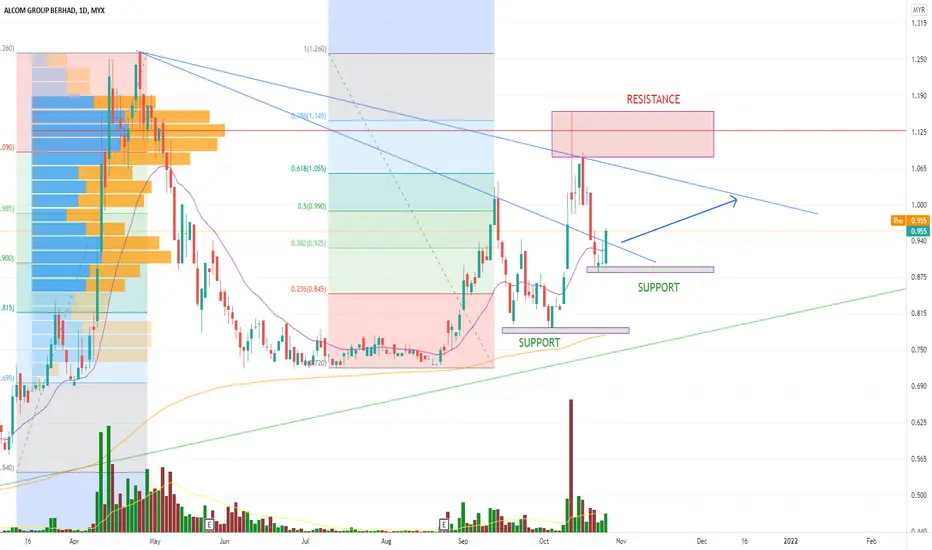
Technical analysis for ALCOM Stock based on Trend Analysis, Chart Pattern and Fibonacci Retracement
บันทึก
Current price candle has break the immediate support line. Price candle 8 Nov 21 show Demand Test Candle with low volume-positive result. Price may move lower to next support line at 0.790.ปิดการเทรด: ถึงเป้าหมายการตัดขาดทุน
This stock lost momentum, don' take position in this stockAHI
คำจำกัดสิทธิ์ความรับผิดชอบ
ข้อมูลและบทความไม่ได้มีวัตถุประสงค์เพื่อก่อให้เกิดกิจกรรมทางการเงิน, การลงทุน, การซื้อขาย, ข้อเสนอแนะ หรือคำแนะนำประเภทอื่น ๆ ที่ให้หรือรับรองโดย TradingView อ่านเพิ่มเติมที่ ข้อกำหนดการใช้งาน
AHI
คำจำกัดสิทธิ์ความรับผิดชอบ
ข้อมูลและบทความไม่ได้มีวัตถุประสงค์เพื่อก่อให้เกิดกิจกรรมทางการเงิน, การลงทุน, การซื้อขาย, ข้อเสนอแนะ หรือคำแนะนำประเภทอื่น ๆ ที่ให้หรือรับรองโดย TradingView อ่านเพิ่มเติมที่ ข้อกำหนดการใช้งาน