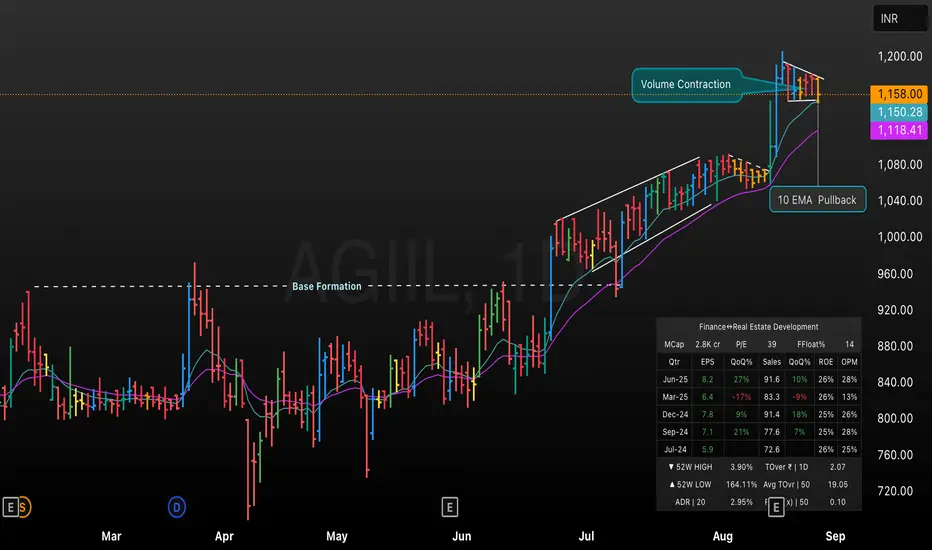
This TradingView chart showcases AGIIL’s technical progression from a prolonged base formation to a strong breakout phase, supported by notable volume contraction and a textbook 10 EMA pullback. Key chart highlights include identification of base formation, a rising price channel, and consolidation with EMA support. The volume contraction and recent price pullback to the 10 EMA reflect a healthy setup typically seen before sustained upward movement, making AGIIL a candidate for breakout trade strategies. Core metrics such as market cap, EPS growth, 52-week range, and liquidity are also visually summarized for quick reference.
คำจำกัดสิทธิ์ความรับผิดชอบ
ข้อมูลและบทความไม่ได้มีวัตถุประสงค์เพื่อก่อให้เกิดกิจกรรมทางการเงิน, การลงทุน, การซื้อขาย, ข้อเสนอแนะ หรือคำแนะนำประเภทอื่น ๆ ที่ให้หรือรับรองโดย TradingView อ่านเพิ่มเติมที่ ข้อกำหนดการใช้งาน
คำจำกัดสิทธิ์ความรับผิดชอบ
ข้อมูลและบทความไม่ได้มีวัตถุประสงค์เพื่อก่อให้เกิดกิจกรรมทางการเงิน, การลงทุน, การซื้อขาย, ข้อเสนอแนะ หรือคำแนะนำประเภทอื่น ๆ ที่ให้หรือรับรองโดย TradingView อ่านเพิ่มเติมที่ ข้อกำหนดการใช้งาน