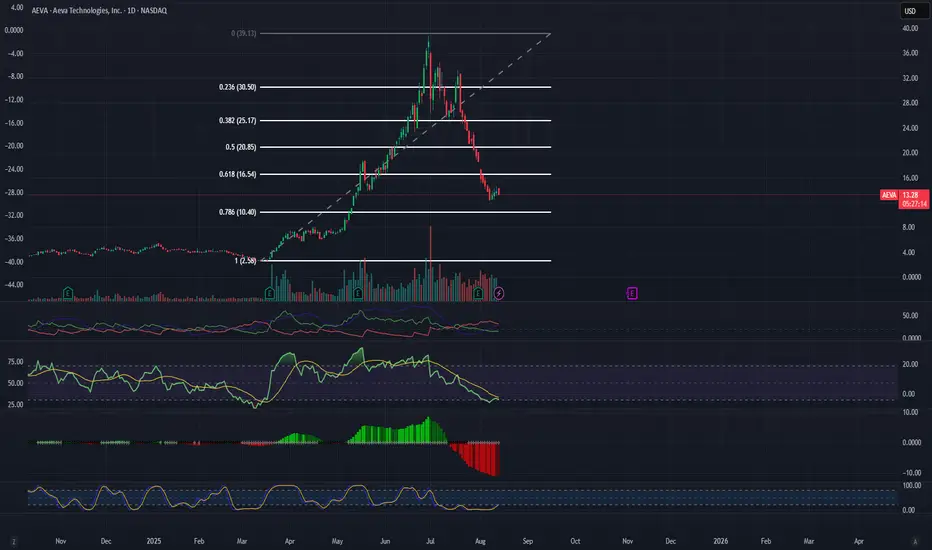
AEVA has experienced a major pullback from its highs, retracing deeply into the Fibonacci levels. On the weekly timeframe, a Cup & Handle structure is forming right at a key reversal zone. Recent price action and indicators suggest that the stock may be ready to change direction and start a new bullish leg.
Technical Highlights:
Pattern: Weekly Cup & Handle emerging after a deep correction.
Fibonacci Levels: Price is currently hovering between the 0.618 ($16.54) and 0.786 ($10.40) retracement zones – historically strong reversal areas.
Indicators:
MACD: Bearish momentum is slowing down, setting up for a potential bullish crossover.
RSI: Recovering from oversold levels, showing early signs of strength.
Stochastic: Turning upwards from the bottom, signaling momentum shift.
ADX: Suggests a weakening downtrend, leaving room for buyers to take control.
Volume: Recent spikes during upward sessions show renewed accumulation interest.
Fundamental Catalyst: Strong earnings report recently released, adding confidence to the technical setup.
Trade Plan:
Entry: Above $14.50 on confirmation of upward momentum.
Target 1: $16.54 (Fib 0.618)
Target 2: $20.85 (Fib 0.5)
Stop Loss: Close below $10.40 (Fib 0.786).
Summary:
AEVA is lining up a high-probability reversal trade: deep Fibonacci retracement, a forming Cup & Handle on the weekly, bullish momentum building, and a strong earnings catalyst. A breakout from current consolidation could ignite a substantial recovery rally.
คำจำกัดสิทธิ์ความรับผิดชอบ
ข้อมูลและบทความไม่ได้มีวัตถุประสงค์เพื่อก่อให้เกิดกิจกรรมทางการเงิน, การลงทุน, การซื้อขาย, ข้อเสนอแนะ หรือคำแนะนำประเภทอื่น ๆ ที่ให้หรือรับรองโดย TradingView อ่านเพิ่มเติมใน ข้อกำหนดการใช้งาน
คำจำกัดสิทธิ์ความรับผิดชอบ
ข้อมูลและบทความไม่ได้มีวัตถุประสงค์เพื่อก่อให้เกิดกิจกรรมทางการเงิน, การลงทุน, การซื้อขาย, ข้อเสนอแนะ หรือคำแนะนำประเภทอื่น ๆ ที่ให้หรือรับรองโดย TradingView อ่านเพิ่มเติมใน ข้อกำหนดการใช้งาน