Greetings Traders,
Today, we’re taking a closer look at ADIB (Abu Dhabi Islamic Bank) — an interesting setup forming on the chart!
Key Highlights:
Keep an eye on volume during the breakout — confirmation is key.
Happy Trading & Stay Disciplined!
Today, we’re taking a closer look at ADIB (Abu Dhabi Islamic Bank) — an interesting setup forming on the chart!
Key Highlights:
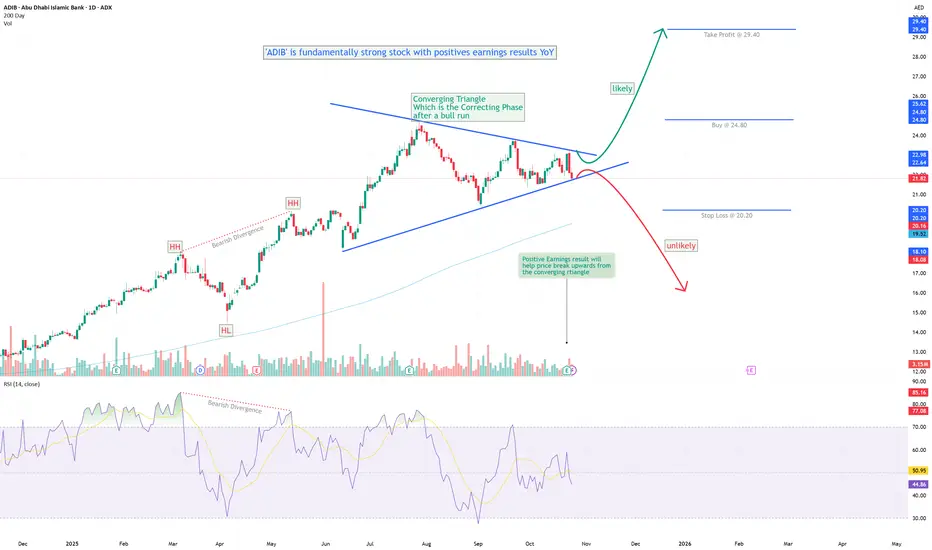
- Fundamentally strong: ADIB continues to deliver solid YoY earnings growth.
- Bearish divergence was observed earlier, leading to strong selling pressure, followed by the formation of a converging triangle pattern.
- This triangle appears to represent a corrective phase after a prolonged bullish rally.
- The stock recently announced positive earnings results, reinforcing the underlying strength.
- Considering the technical and fundamental setup, a bullish breakout from the triangle looks probable.
- Trading Plan: Wait for a confirmed breakout above the upper trendline before entering a cautious long position. Traders can take a risky position after break-out of triangle. And for Cautious traders wait for the breakout from the upper tip of the triangle.
- Stop Loss: Below the recent swing low.
Keep an eye on volume during the breakout — confirmation is key.
Happy Trading & Stay Disciplined!
คำจำกัดสิทธิ์ความรับผิดชอบ
ข้อมูลและบทความไม่ได้มีวัตถุประสงค์เพื่อก่อให้เกิดกิจกรรมทางการเงิน, การลงทุน, การซื้อขาย, ข้อเสนอแนะ หรือคำแนะนำประเภทอื่น ๆ ที่ให้หรือรับรองโดย TradingView อ่านเพิ่มเติมใน ข้อกำหนดการใช้งาน
คำจำกัดสิทธิ์ความรับผิดชอบ
ข้อมูลและบทความไม่ได้มีวัตถุประสงค์เพื่อก่อให้เกิดกิจกรรมทางการเงิน, การลงทุน, การซื้อขาย, ข้อเสนอแนะ หรือคำแนะนำประเภทอื่น ๆ ที่ให้หรือรับรองโดย TradingView อ่านเพิ่มเติมใน ข้อกำหนดการใช้งาน