While the CNBC-driven public keeps buying the stocks because they are "still relatively cheap" the other few percent of those who understand that they are not are looking for a good entry in a short position on S&P. While S&P chart seems to be tracing an ending diagonal it still looks very fuzzy and the end of the ascending movement may be hard to spot in real time.
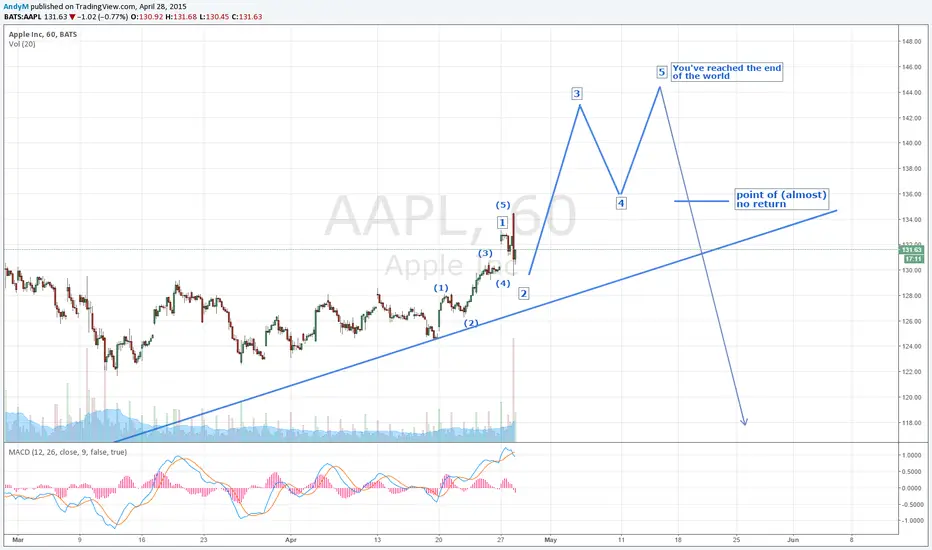
I think an alternative to analyzing the S&P chart would be to look at our flagship and S&P ambassador - AAPL: the last wave 5 of wave 5 is unfolding in front of our eyes. Wave 1 is over, Wave 2 is completing. Wave 3,4,5 are left. Once these are over, S&P is likely done too. I multiplied the duration of wave 1 by three in order to assess the approximate timing of the reversal. We are likely to end at circa 144, on May 14, 5pm GMT. It will be sunny :))
I think an alternative to analyzing the S&P chart would be to look at our flagship and S&P ambassador - AAPL: the last wave 5 of wave 5 is unfolding in front of our eyes. Wave 1 is over, Wave 2 is completing. Wave 3,4,5 are left. Once these are over, S&P is likely done too. I multiplied the duration of wave 1 by three in order to assess the approximate timing of the reversal. We are likely to end at circa 144, on May 14, 5pm GMT. It will be sunny :))
คำจำกัดสิทธิ์ความรับผิดชอบ
ข้อมูลและบทความไม่ได้มีวัตถุประสงค์เพื่อก่อให้เกิดกิจกรรมทางการเงิน, การลงทุน, การซื้อขาย, ข้อเสนอแนะ หรือคำแนะนำประเภทอื่น ๆ ที่ให้หรือรับรองโดย TradingView อ่านเพิ่มเติมที่ ข้อกำหนดการใช้งาน
คำจำกัดสิทธิ์ความรับผิดชอบ
ข้อมูลและบทความไม่ได้มีวัตถุประสงค์เพื่อก่อให้เกิดกิจกรรมทางการเงิน, การลงทุน, การซื้อขาย, ข้อเสนอแนะ หรือคำแนะนำประเภทอื่น ๆ ที่ให้หรือรับรองโดย TradingView อ่านเพิ่มเติมที่ ข้อกำหนดการใช้งาน