## Japanese Yen Futures Short - Technical Narrative 📊
### The Elliott Wave Story (1→5)
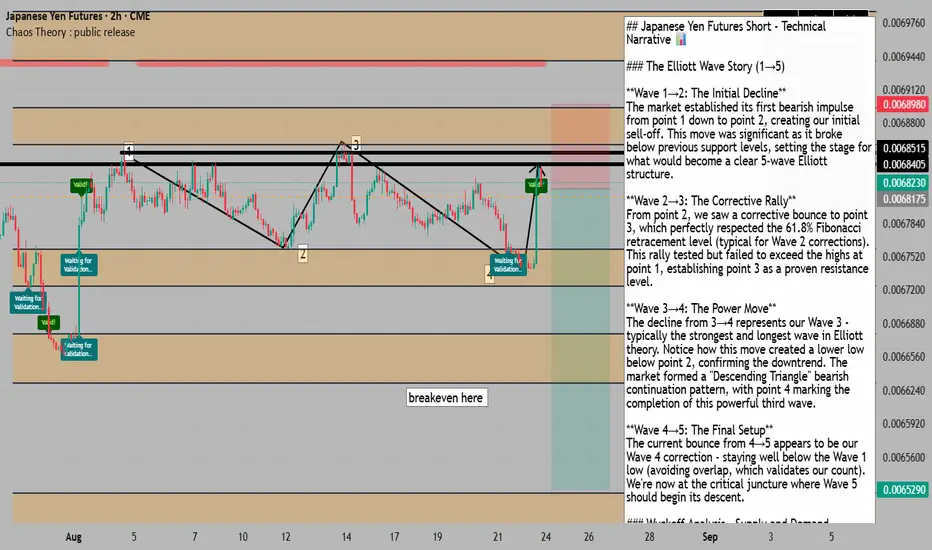
**Wave 1→2: The Initial Decline**
The market established its first bearish impulse from point 1 down to point 2, creating our initial sell-off. This move was significant as it broke below previous support levels, setting the stage for what would become a clear 5-wave Elliott structure.
**Wave 2→3: The Corrective Rally**
From point 2, we saw a corrective bounce to point 3, which perfectly respected the 61.8% Fibonacci retracement level (typical for Wave 2 corrections). This rally tested but failed to exceed the highs at point 1, establishing point 3 as a proven resistance level.
**Wave 3→4: The Power Move**
The decline from 3→4 represents our Wave 3 - typically the strongest and longest wave in Elliott theory. Notice how this move created a lower low below point 2, confirming the downtrend. The market formed a "Descending Triangle" bearish continuation pattern, with point 4 marking the completion of this powerful third wave.
**Wave 4→5: The Final Setup**
The current bounce from 4→5 appears to be our Wave 4 correction - staying well below the Wave 1 low (avoiding overlap, which validates our count). We're now at the critical juncture where Wave 5 should begin its descent.
### Wyckoff Analysis - Supply and Demand Dynamics
Points 1 and 3 represent **proven sellers** - they've demonstrated their strength by pushing price below the uptrend support from point 2. The move from 4→5 represents a "return to supply" - weak buyers attempting to rally but meeting the dominant sellers who control this market. This is textbook Wyckoff distribution.
### The Chaos Zone Confluence 🎯
Your orange zones align perfectly with our analysis:
- Upper zone rejection at current levels (0.00682)
- "Breakeven here" notation at 0.006625 provides our first target
- Lower zone at 0.006529 offers our extended target
With chaos theory zones showing a 63% breakdown success rate over 2,500 candles, the probability favors continuation lower.
### Technical Divergences & Patterns
You've correctly identified:
- **Bearish divergence** on MFI and RSI
- **Sharp triangle turn** pattern suggesting reversal
- **Lower low confirmation** on the recent 2H candle close
### Fundamental Catalysts 🌍
The technical setup gains massive conviction from:
- Record net-long positioning in Yen futures (298k contracts) - extreme sentiment ready to unwind
- BOJ maintaining dovish stance at 0.50% while markets positioned for hawkish surprises
- Daily chart showing multiple rejections at 0.0068260 resistance level
### The Trade Setup 🎯
**ENTRY**: Market entry at 0.006822
**STOP LOSS OPTIONS**:
1. **Conservative**: Above points 1 & 3 at 0.006855 (33 pips risk)
2. **Aggressive**: Just above point 5 high at 0.006835 (13 pips risk)
**TARGETS**:
- **TP1**: 0.006625 (Chaos zone "breakeven" level) - 197 pips
- **TP2**: 0.006529 (Lower chaos zone) - 293 pips
**Risk/Reward**:
- Conservative stop: 1:6 R/R to TP1, 1:9 R/R to TP2
- Aggressive stop: 1:15 R/R to TP1, 1:22 R/R to TP2
### The Narrative Conclusion 📝
We have a complete Elliott Wave 5-wave structure approaching its final leg down. The Wyckoff distribution shows sellers in control at points 1 and 3, with buyers exhausted at point 4. The current position at point 5 represents the last gasp before the markdown phase.
Combined with:
- Record speculative long positioning ready to liquidate
- BOJ dovishness versus market expectations
- Major daily resistance overhead
- Chaos zones predicting downside with 63% accuracy
- Technical divergences confirming weakness
**This sets up a HIGH-CONVICTION short with exceptional risk/reward.**
The aggressive stop above point 5 (0.006835) makes more sense given the strong resistance and allows for massive R/R. If we're wrong and break above, we want out quickly anyway. The two-zone target strategy lets you take partial profits at the first chaos zone and ride the rest to the lower target.
**The stars have aligned: Elliott Waves + Wyckoff + Chaos Theory + COT Extremes + BOJ Fundamentals = SELL** 🎯
### The Elliott Wave Story (1→5)
**Wave 1→2: The Initial Decline**
The market established its first bearish impulse from point 1 down to point 2, creating our initial sell-off. This move was significant as it broke below previous support levels, setting the stage for what would become a clear 5-wave Elliott structure.
**Wave 2→3: The Corrective Rally**
From point 2, we saw a corrective bounce to point 3, which perfectly respected the 61.8% Fibonacci retracement level (typical for Wave 2 corrections). This rally tested but failed to exceed the highs at point 1, establishing point 3 as a proven resistance level.
**Wave 3→4: The Power Move**
The decline from 3→4 represents our Wave 3 - typically the strongest and longest wave in Elliott theory. Notice how this move created a lower low below point 2, confirming the downtrend. The market formed a "Descending Triangle" bearish continuation pattern, with point 4 marking the completion of this powerful third wave.
**Wave 4→5: The Final Setup**
The current bounce from 4→5 appears to be our Wave 4 correction - staying well below the Wave 1 low (avoiding overlap, which validates our count). We're now at the critical juncture where Wave 5 should begin its descent.
### Wyckoff Analysis - Supply and Demand Dynamics
Points 1 and 3 represent **proven sellers** - they've demonstrated their strength by pushing price below the uptrend support from point 2. The move from 4→5 represents a "return to supply" - weak buyers attempting to rally but meeting the dominant sellers who control this market. This is textbook Wyckoff distribution.
### The Chaos Zone Confluence 🎯
Your orange zones align perfectly with our analysis:
- Upper zone rejection at current levels (0.00682)
- "Breakeven here" notation at 0.006625 provides our first target
- Lower zone at 0.006529 offers our extended target
With chaos theory zones showing a 63% breakdown success rate over 2,500 candles, the probability favors continuation lower.
### Technical Divergences & Patterns
You've correctly identified:
- **Bearish divergence** on MFI and RSI
- **Sharp triangle turn** pattern suggesting reversal
- **Lower low confirmation** on the recent 2H candle close
### Fundamental Catalysts 🌍
The technical setup gains massive conviction from:
- Record net-long positioning in Yen futures (298k contracts) - extreme sentiment ready to unwind
- BOJ maintaining dovish stance at 0.50% while markets positioned for hawkish surprises
- Daily chart showing multiple rejections at 0.0068260 resistance level
### The Trade Setup 🎯
**ENTRY**: Market entry at 0.006822
**STOP LOSS OPTIONS**:
1. **Conservative**: Above points 1 & 3 at 0.006855 (33 pips risk)
2. **Aggressive**: Just above point 5 high at 0.006835 (13 pips risk)
**TARGETS**:
- **TP1**: 0.006625 (Chaos zone "breakeven" level) - 197 pips
- **TP2**: 0.006529 (Lower chaos zone) - 293 pips
**Risk/Reward**:
- Conservative stop: 1:6 R/R to TP1, 1:9 R/R to TP2
- Aggressive stop: 1:15 R/R to TP1, 1:22 R/R to TP2
### The Narrative Conclusion 📝
We have a complete Elliott Wave 5-wave structure approaching its final leg down. The Wyckoff distribution shows sellers in control at points 1 and 3, with buyers exhausted at point 4. The current position at point 5 represents the last gasp before the markdown phase.
Combined with:
- Record speculative long positioning ready to liquidate
- BOJ dovishness versus market expectations
- Major daily resistance overhead
- Chaos zones predicting downside with 63% accuracy
- Technical divergences confirming weakness
**This sets up a HIGH-CONVICTION short with exceptional risk/reward.**
The aggressive stop above point 5 (0.006835) makes more sense given the strong resistance and allows for massive R/R. If we're wrong and break above, we want out quickly anyway. The two-zone target strategy lets you take partial profits at the first chaos zone and ride the rest to the lower target.
**The stars have aligned: Elliott Waves + Wyckoff + Chaos Theory + COT Extremes + BOJ Fundamentals = SELL** 🎯
for trading mentorship and community, message me on telegram : jacesabr_real
คำจำกัดสิทธิ์ความรับผิดชอบ
ข้อมูลและบทความไม่ได้มีวัตถุประสงค์เพื่อก่อให้เกิดกิจกรรมทางการเงิน, การลงทุน, การซื้อขาย, ข้อเสนอแนะ หรือคำแนะนำประเภทอื่น ๆ ที่ให้หรือรับรองโดย TradingView อ่านเพิ่มเติมที่ ข้อกำหนดการใช้งาน
for trading mentorship and community, message me on telegram : jacesabr_real
คำจำกัดสิทธิ์ความรับผิดชอบ
ข้อมูลและบทความไม่ได้มีวัตถุประสงค์เพื่อก่อให้เกิดกิจกรรมทางการเงิน, การลงทุน, การซื้อขาย, ข้อเสนอแนะ หรือคำแนะนำประเภทอื่น ๆ ที่ให้หรือรับรองโดย TradingView อ่านเพิ่มเติมที่ ข้อกำหนดการใช้งาน