I'd like to learn more about Pine Logs
To enable logs you could use one of three new logging functions:
- log.error() creates messages of type Error displayed in red.
- log.info() creates messages of type Info displayed in gray.
- log.warning() creates messages of type Warning displayed in orange.
After adding script on the chart you can open Pine Logs. Use one of the entry points:
- selecting Pine Logs… from the Editor's More menu
- from the More menu of a script loaded on your chart if it uses log.*() functions

Pine Logs work everywhere: on historical bars, in real-time, and in Replay mode. The logging functions can be called from any type of script (indicator, strategy, or library) and from anywhere in the script, including local blocks, loops, and from inside request.security() and similar functions. You can call logging functions in two ways: using only a string argument, or using a formatting string and a list of values in str.format() fashion.
Scripts using logs must be personal scripts; privately or publicly published scripts cannot generate logs, even if they contain calls to log.*() functions.
The following code example uses all three logging functions:
//@version=5
indicator("Pine Logs")
if barstate.ishistory
if bar_index % 100 == 0
log.warning("\nBar index: {0,number,#}", bar_index)
else
// Realtime bar processing.
varip lastTime = timenow
varip updateNo = 0
if barstate.isnew
updateNo := 0
log.error("\nNew bar")
else
log.info("\nUpdate no: {0}\nclose: {1}\nSeconds elapsed: {2}", updateNo, close, (timenow - lastTime) / 1000)
updateNo += 1
lastTime := timenow
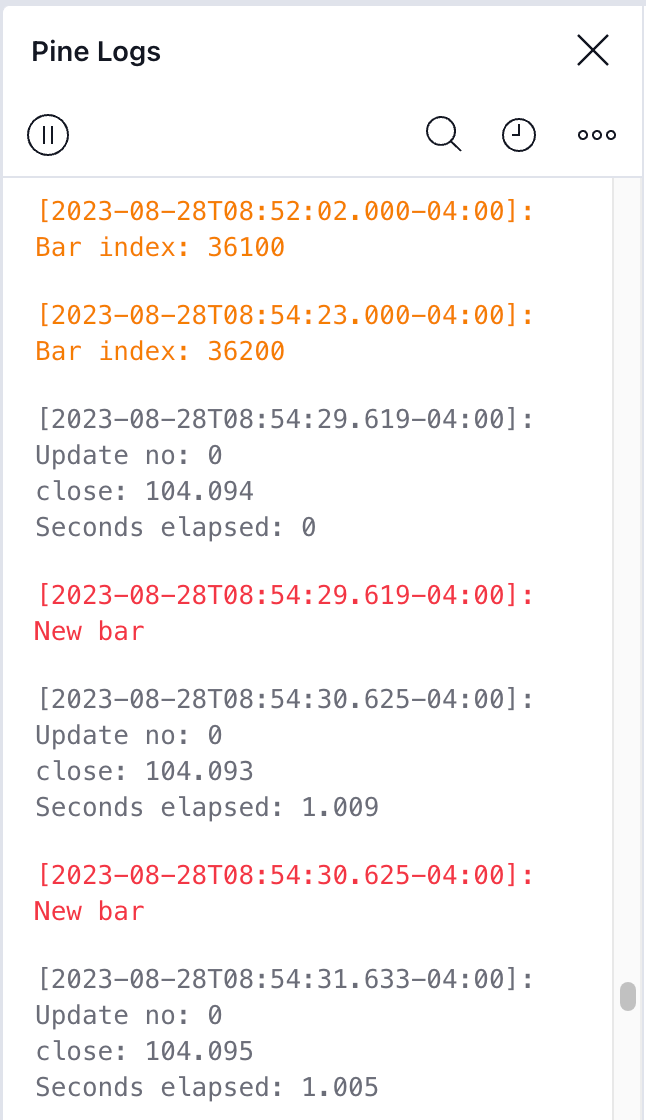
plot(timenow)The example displays the bar index on every hundredth historical bar using an orange warning message. In real-time, it displays an error message in red for each new bar, and for each real-time update, it creates an information message in gray showing the update number, the close price, and the time elapsed since the last chart update.
To see Pine Logs in action:
- Save the above code example to a personal script and add it to a chart with an active market.
- Open the Pine Logs pane using the Editor's More menu or the indicator's More menu on the chart.
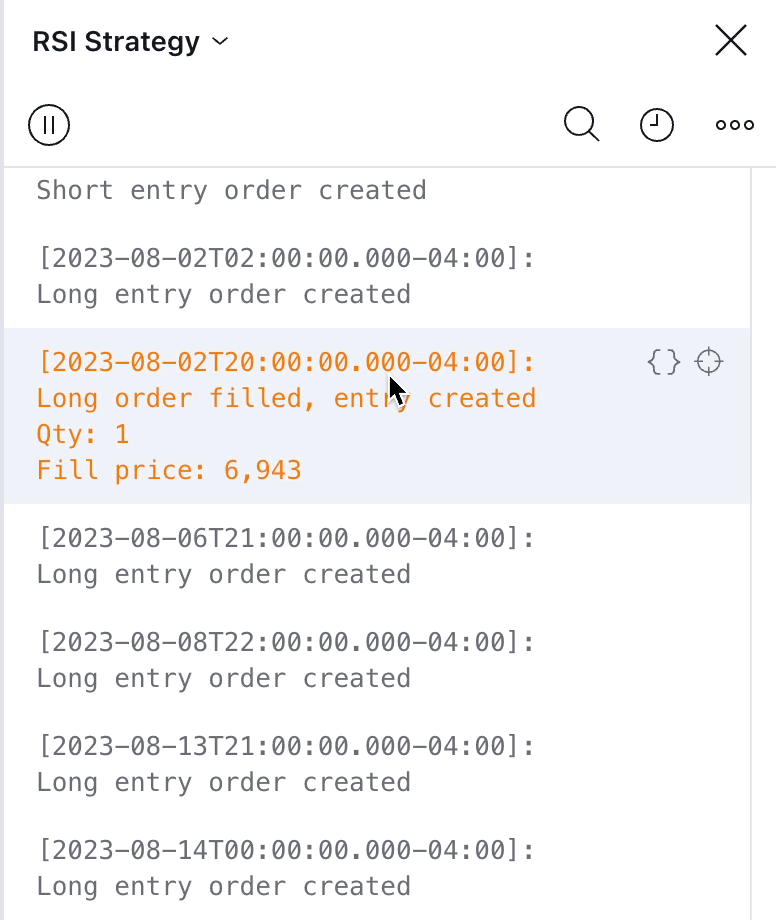
A timestamp prefixes each log entry. It is the bar's opening time for historical bars, and the current time for realtime messages. Newer messages appear at the bottom of the pane. Only the last 10,000 messages will display for historical bars; realtime messages are appended to those.
The top of the pane contains icons allowing you to start/stop the logging, specify a starting date, filter the logs by message type, and search the logs. The search field contains a sub-menu allowing you to match case, whole words, and use regex.
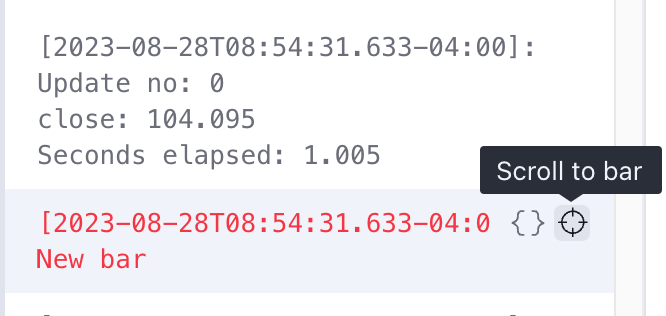
When you hover over a log message, icons appear that allow you to view the source code that has generated the message, or jump to the corresponding chart bar:
When multiple scripts on your chart use logs, each one maintains its own set of messages. You can move between each script's logs by using the dropdown at the top of the Pine Logs pane: