Fixed Range Volume Profile
Definition
Fixed Range Volume Profile (FRVP) indicator calculates volume data within a specified time period, allowing traders to analyse the volume activity of a particular range instead of the entire price movement of an asset.
Note: you can read more about traits shared by all Volume Profile indicators in the Volume Profile Indicators: basic concepts Help Center article. The text below describes features unique to this particular Volume Profile indicator.How to apply FRVP to your chart
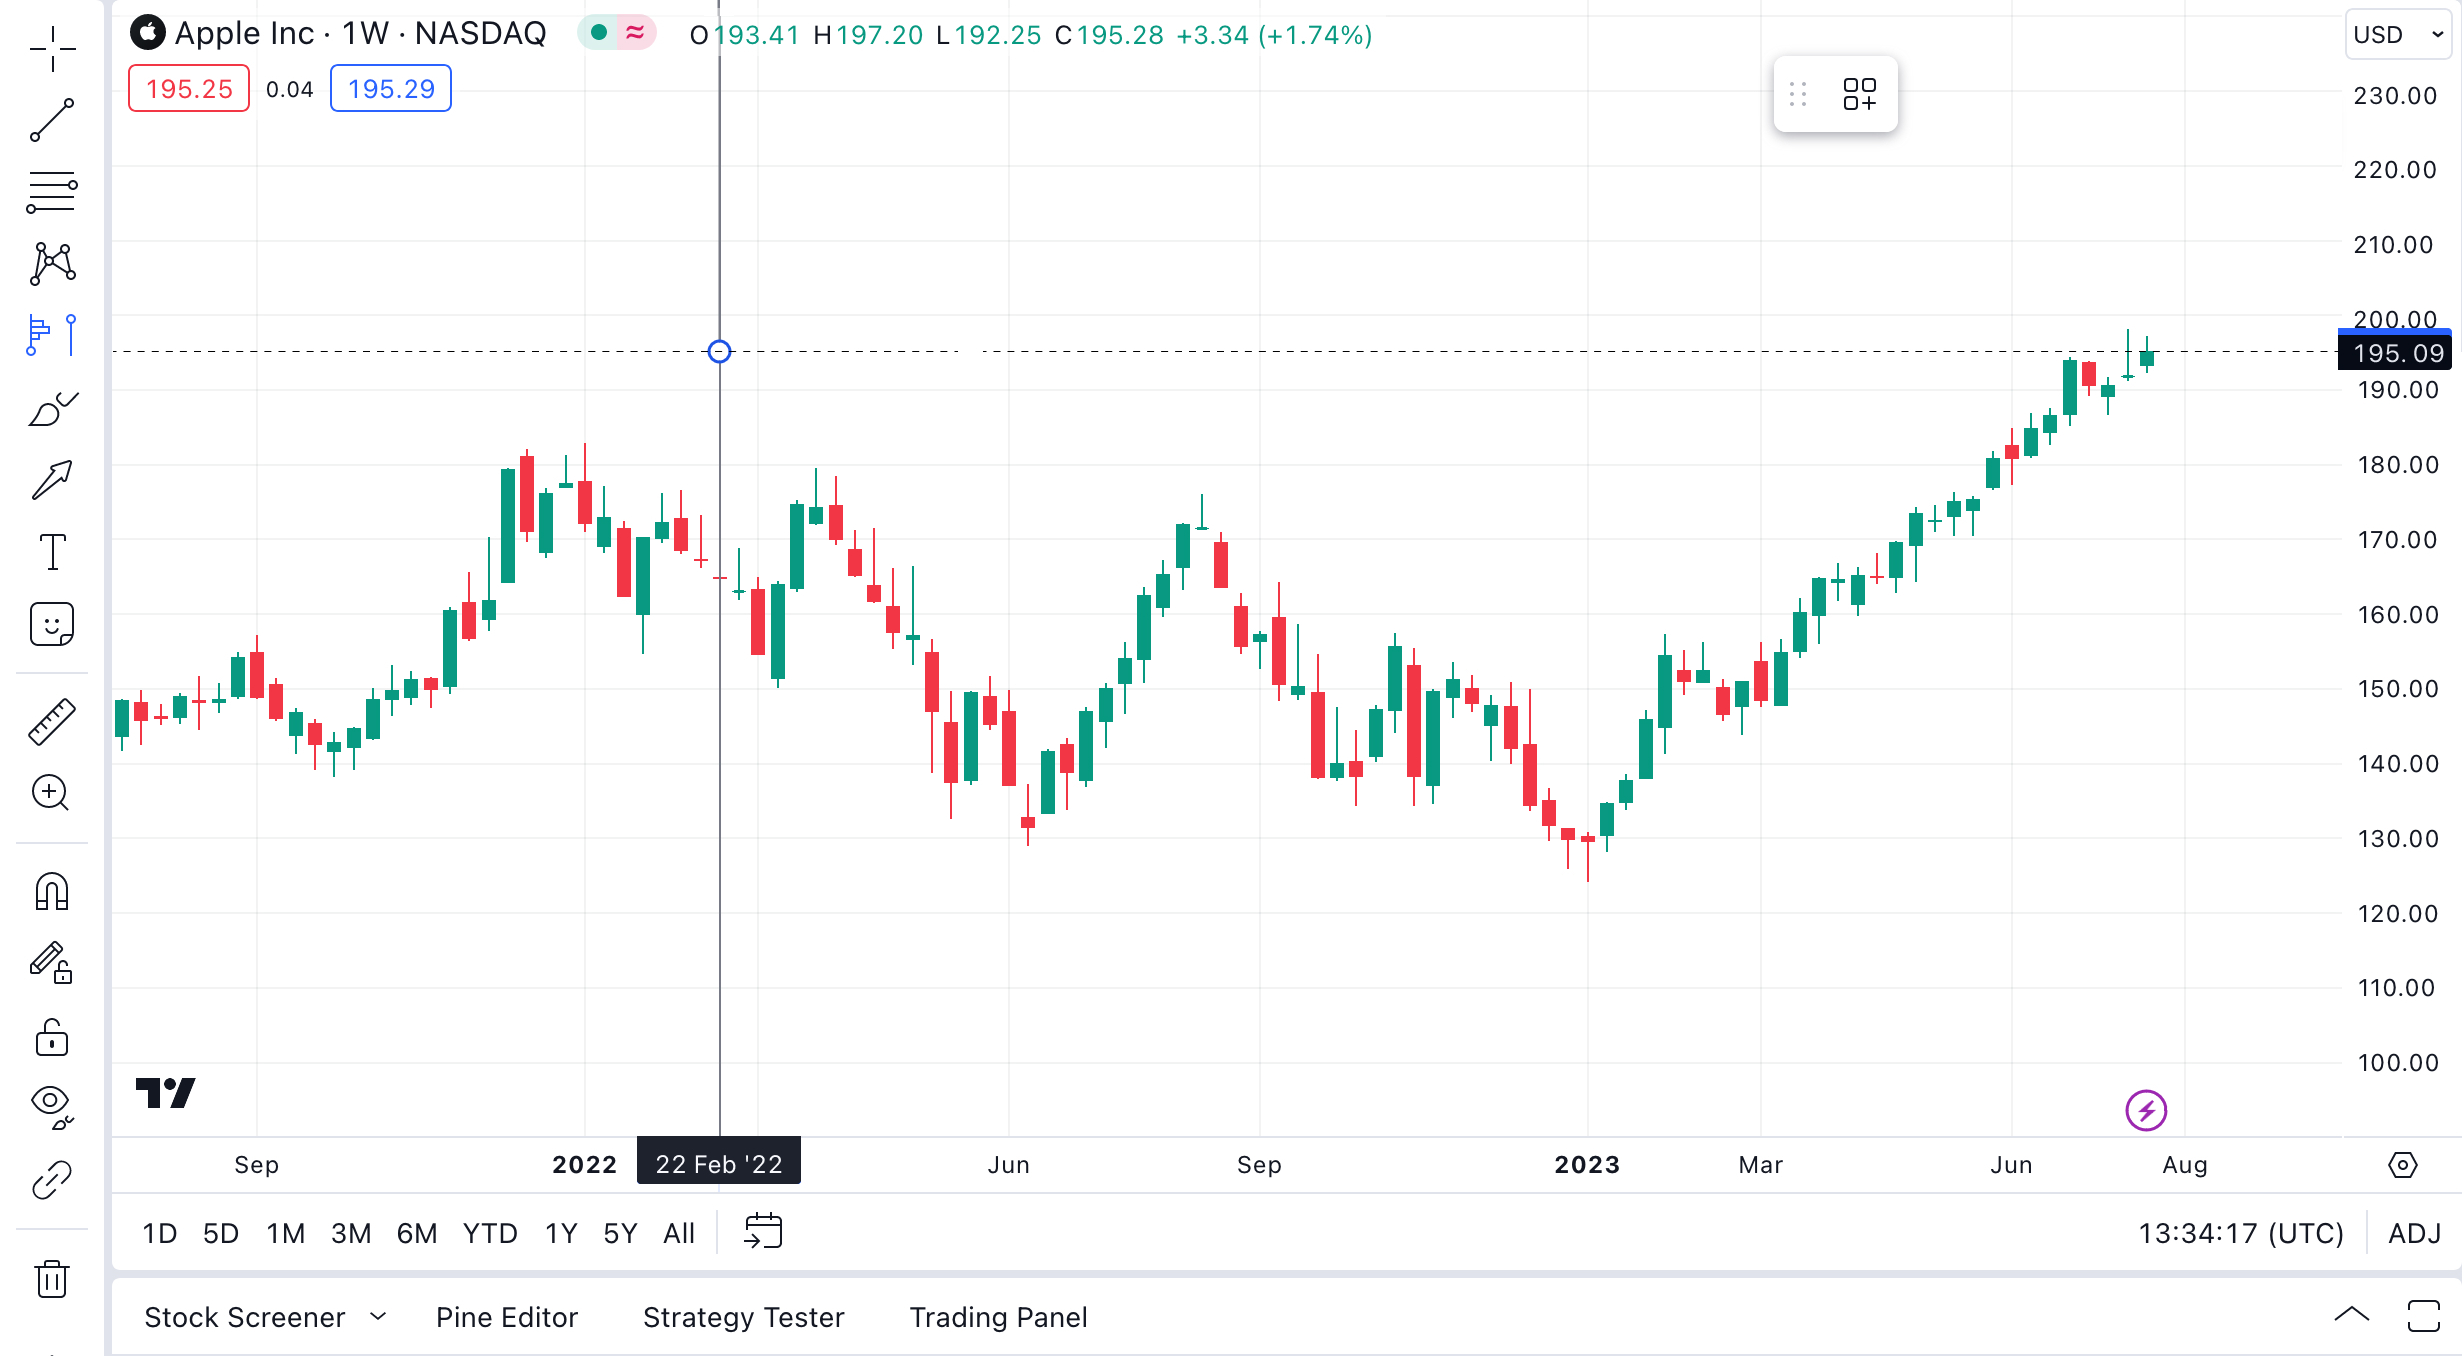
1. Select Fixed Range Volume Profile from the drawing tools list on the chart’s left-side panel, as shown below.

2. Click on the chart to select the first point from which you’d like to start your calculation.
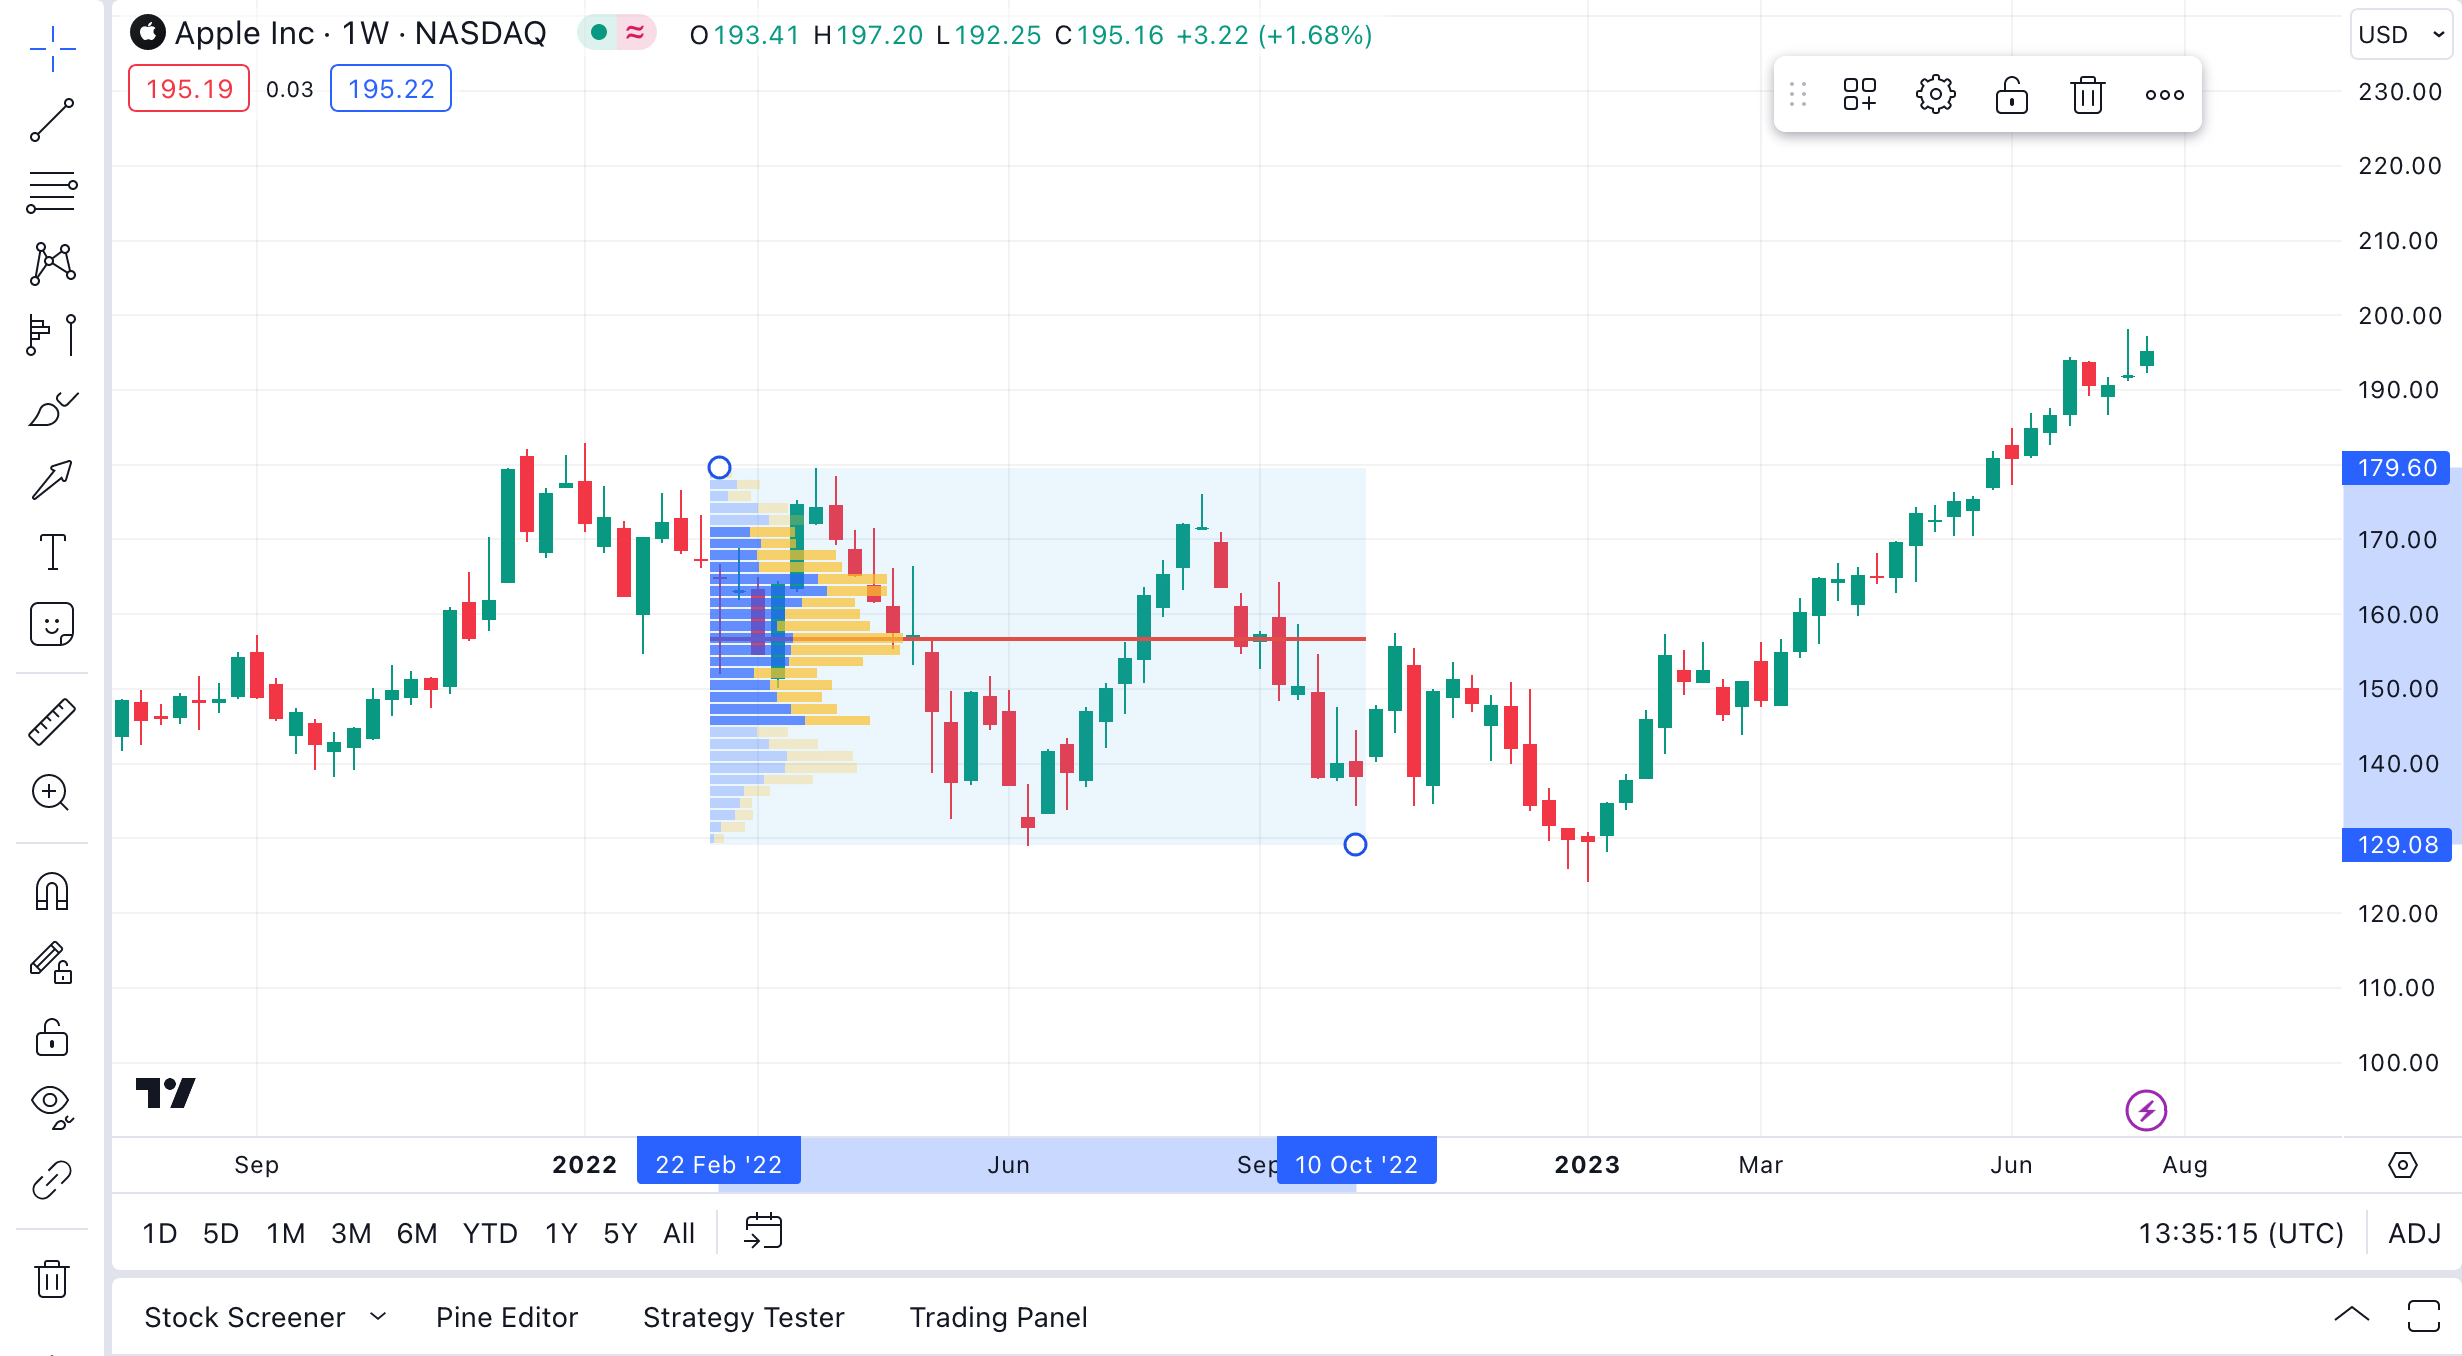
3. Click on another place on the chart to select the second point at which you would like to complete your calculation. The volume profile will be displayed on the chart as pictured below.
Calculation
When calculating Volume Profile Fixed Range, we check a list of timeframes in a sequence until the number of bars in the time interval for which VP is calculated will be fewer than 5000. The sequence of timeframes is: 1, 5, 15, 30, 60, 240, 1D. If the bars that the indicator covers amount in total to 5 minutes or fewer, or if it is used on any second-based timeframe, the indicator will take data from the 1S timeframe for its calculations, regardless of the number of bars covered.
Note: On Futures and Spread charts, Volume Profiles is calculated not by requesting a timeframe with fewer than 5000 bars, but by using a timeframe one step lower than the current one based on the timeframe list above. The exception is all second-based timeframes, which always use 1S data.Consider the following example. The VPFR indicator is set to calculate the profile for the period that starts on the first Monday bar and ends on the last Sunday bar of the same week. The symbol is traded 24x7 (for the sake of the experiment, let's assume there are no gaps where no trades were happening and each minute of every week has a bar associated with it).
- First, the indicator checks the "1" timeframe, sees that the 1m chart for this symbol has 7D * 1440m = 10080 bars of 1m data, which is above the 5000 bar limit. It selects the next timeframe in the sequence.
- Next, the indicator does the same with the "3" timeframe. The 3m chart for the symbol has 7D * (1440 / 3) = 3360 bars of data. This is below the 5000 bar limit, so the 3m bars will be used in the VPFR calculation.
Note: There is a limited number of lower timeframe bars available for the indicator's calculations. If the FRVP is set to be calculated very deep in the symbol's history, there might be no lower timeframe information for that period of time. In such cases, the Chart timeframe will be used for the calculation instead.
To demonstrate this, try adding FRVP to NASDAQ:AAPL, 1D, and setting it up to span a one-day period that starts on Dec 12, 1980. There won't be lower timeframe data for this time interval, so FRVP calculation will be carried out at the Chart resolution (1D).
Building on a single bar
Note that while building Fixed Range Volume Profile on a single bar, the close > open condition is used to calculate the Up/Down Volume. i.e., if close > open, the price movement is considered Up Volume, if close <= open, it's Down Volume.
Inputs

Rows Layout / Row Size
These two inputs specify the way the indicator calculates how many rows each histogram will have.
If the "Rows Layout" input is set to "Number of Rows", the "Row Size" input specifies the total number of rows in the histogram, and the number of ticks per each row is calculated automatically, based on the formula: Ticks Per Row = (Histogram Top - Histogram Bottom) / Number of Rows / Tick size. Depending on the span of the histogram, the Ticks Per Row value can be rounded either up or down, and the total number of rows may exceed what is specified in the limit.
Let's consider a symbol with a tick size of 0.01, and a Volume Profile histogram that spans a price change from 10 to 11, which brings the total number of ticks it spans to 100. If the "Row Size" is set to 25, the height of a single row is (3 - 2) / 25 / 0.01 = 4 ticks. The resulting histogram has 25 rows, with each row spanning 4 ticks.
If the row height calculation results in a floating point number, the indicator rounds the Ticks Per Row calculation to ensure the height is a whole number. It may also create additional rows to ensure all of the data is represented in the histogram. Whether the Ticks Per Row value is rounded up or down depends on which one results in a total number of rows that is closer to the value in the "Row Size" input.
For example, if in the case above the "Row Size" input is changed to 30, the initial row height is (3 - 2) / 30 / 0.01 = 3.333 ticks per each row.
If this number is then rounded to the nearest integer, 3, each row in the the resulting histogram has 3 ticks per row. As a result, the first 30 rows only account for 30 * 3 = 90 ticks out of a hundred that the histogram spans. This leaves 10 ticks unaccounted for, and for them, four additional rows are created -- the first three with the size of 3, and the last one with the size of 1, increasing the total number of rows to 34.
If it is rounded up instead, each row in the histogram has a height of 4 ticks. In this case, all 100 ticks fit into 25 rows with no remainder. As 34 rows is closer to 30, the requested "Row Size", the indicator uses 3 ticks as the row height.
If this input is set to “Ticks Per Row”, Row Size indicates the number of ticks in each single row (1 tick being the minimal move the price for this symbol can make: for example, for NASDAQ:AAPL, 1 tick is 0.01 because the price needs to move at least 0.01 USD, i.e. 1 cent). E.g., setting it to 25 will mean that each row has the height of 25 ticks. In that case, the number of rows will be calculated automatically, and the Volume Profile histogram spanning the price from 200 to 300 for a symbol with a tick size of 0.01 will have (300 - 200) / 0.01 / 25 = 400 rows per each histogram.
Volume
Toggles between showing total volume for each row (Total), splitting each row into up/down (Up/Down), or showing their difference (Delta).
Value Area Volume
Specifies what percentage of all volume for the trading session should be highlighted by Value Area.
Extend Right
The Extend Right parameter allows one to continue building the profile, including all historical candles and all new emerging candles to the right of the second coordinate.
Coordinates
#1 (bar) - sets the position of the left border of the Volume Profile. The VP will start before this position.
#2 (bar) - sets the position of the right border of the Volume Profile. The VP will end after this position.