Bullish Rising window: tracking momentum surges in a bull market
The bullish Rising window is a two-candle continuation pattern that appears during an uptrend. The low of the second candle is above the high of the first candle, which leaves an empty space, or gap, between them. In candlestick terms this gap is called a window, and traders often treat it as a possible support area.
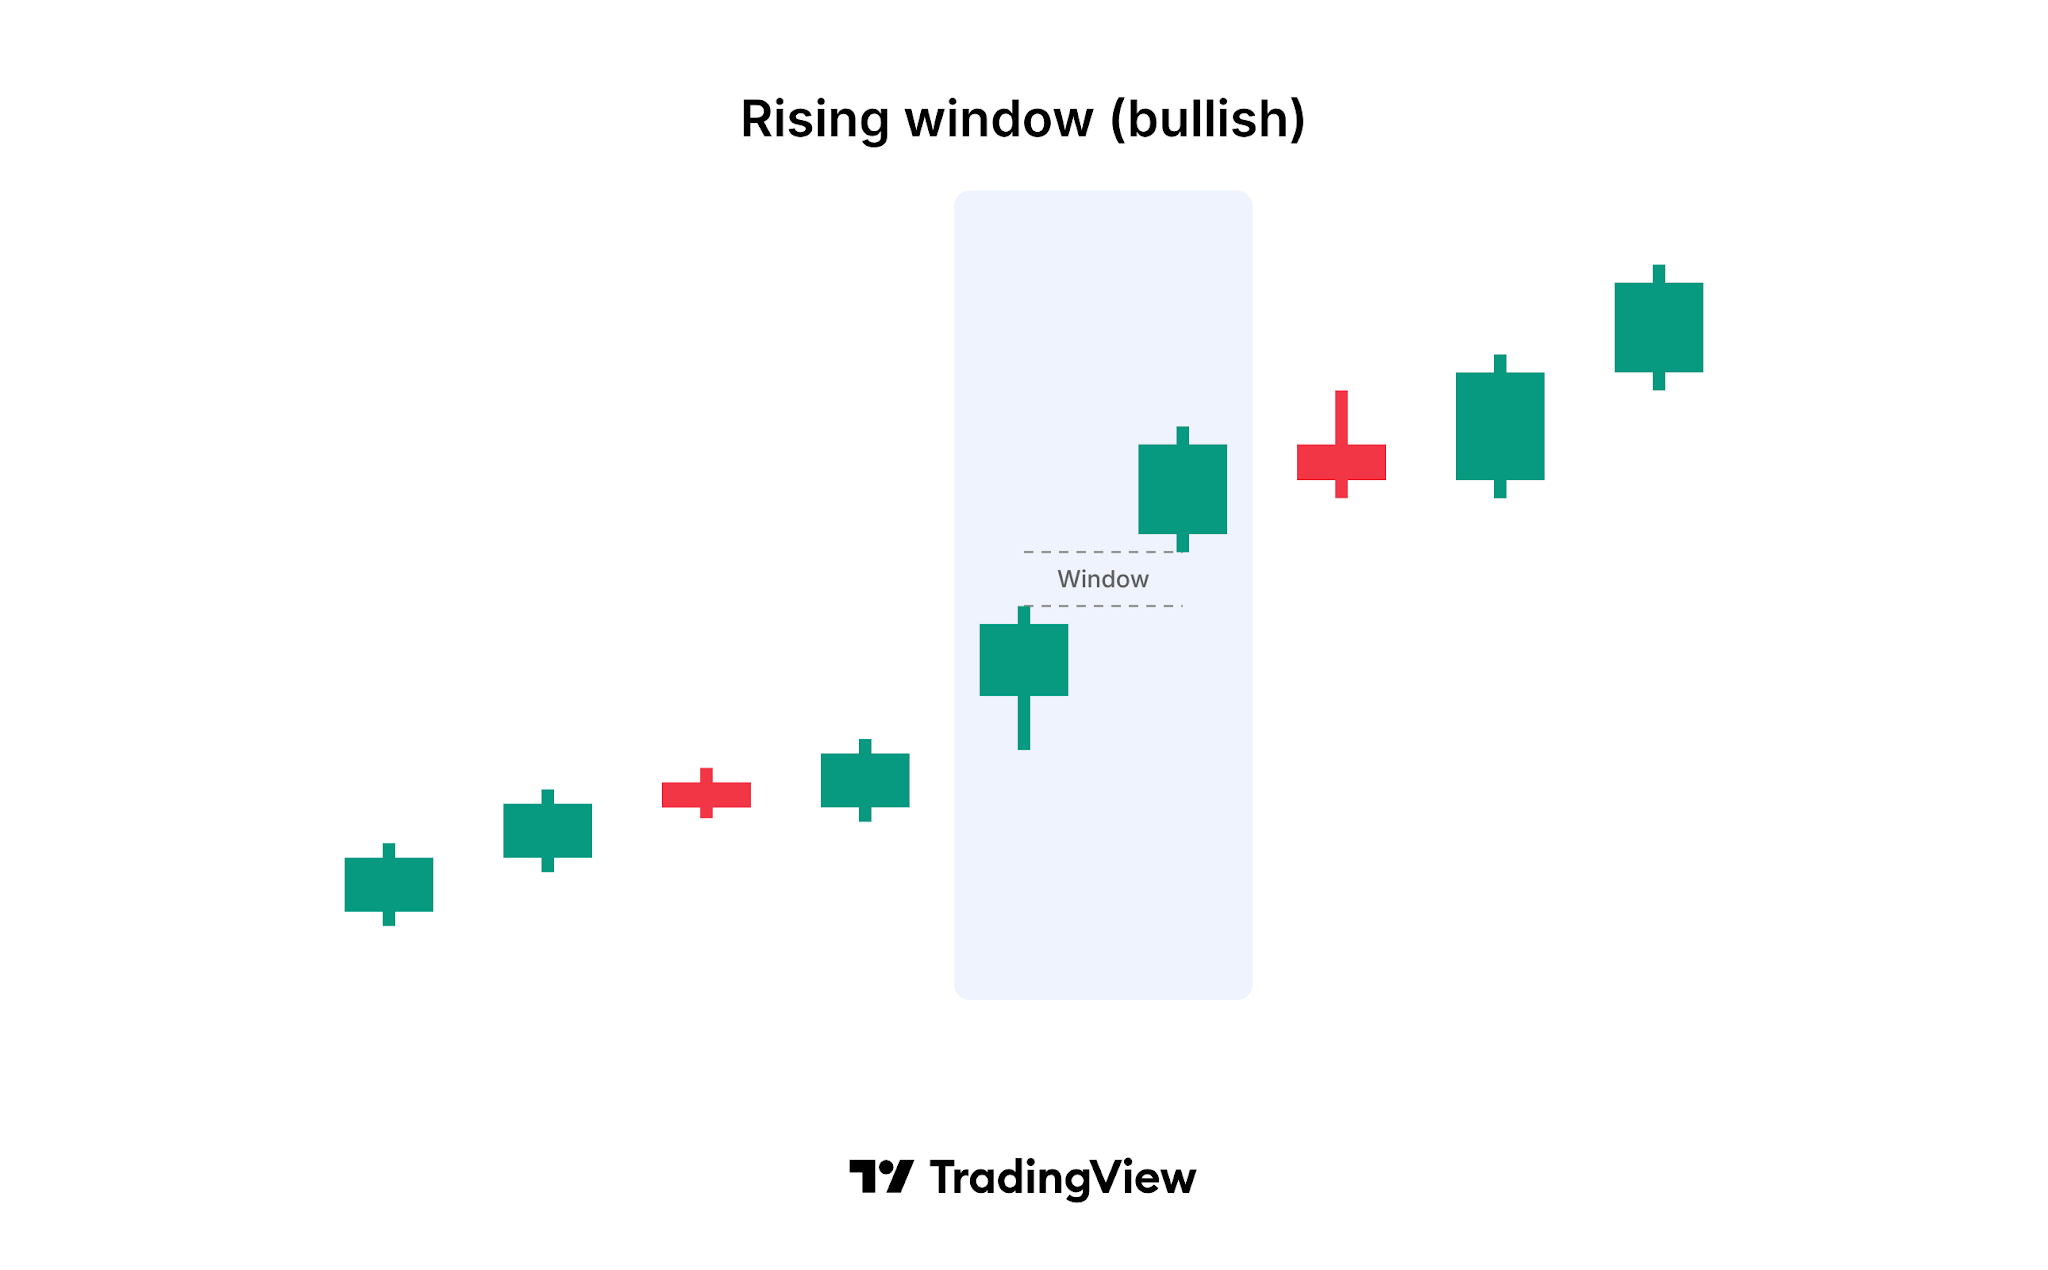
What does a bullish Rising window look like?
The pattern forms over two consecutive candles:
- First candle: Any candle that forms during an uptrend. It can be bullish (white or green) or bearish (black or red).
- Second candle: Any candle whose low is above the high of the first candle.
- Window: The empty price range between the high of the first candle and the low of the second candle.
The candle types matter less than the gap itself. The only exception is the Four-price Doji, a candle where the open, high, low, and close are all the same; neither candle in the pattern can be one.
What does the pattern tell you?
A rising window means that no trading took place in the price range between the two candles. Buyers were willing to pay more than the previous session's high from the very start of the new session, and sellers could not push the price back down into the previous range.
In an uptrend, this shows strong demand and suggests that the trend may continue. Japanese candlestick tradition holds that the window often acts as support later: if the price pulls back, buyers may step in somewhere within the gap.
How reliable is the bullish Rising window?
The Rising window is a continuation signal, so it only has meaning within an existing uptrend. Gaps are much more common in stocks and futures, where trading pauses overnight or over the weekend, than in markets that trade around the clock, such as crypto and forex.
Traders usually look for extra evidence before acting on the signal:
- Prior trend: The pattern requires an uptrend before the gap.
- Volume: Higher volume on the second candle suggests broad participation in the move.
- Gap holding: If later pullbacks stop within or above the window, it confirms the window as support.
How does the Rising window relate to price gaps?
A Rising window is the candlestick name for a gap up. In Western technical analysis, gaps are often grouped by where they appear in a trend: breakaway gaps at the start of a move, runaway gaps in the middle, and exhaustion gaps near the end. A Rising window in a mature uptrend can be an exhaustion gap, so its position within the trend matters. The bearish counterpart is the Falling window, a gap down during a downtrend.
What are the limitations of the pattern?
Like any candlestick pattern, the bullish Rising window describes what has happened, not what will happen. Many gaps are filled, meaning the price returns into the window and closes it. A close below the bottom of the window is often taken as a sign that the support has failed and that the uptrend may be weakening. Traders often combine the pattern with stop-loss levels, for example below the high of the first candle, to limit losses if the gap fills.
How to find the bullish Rising window on TradingView
TradingView can detect this pattern for you on any chart:
- Built-in indicator: Open Indicators and search for Rising window (bullish). The indicator marks each occurrence on the chart.
- All candlestick patterns at once: Add the All candlestick patterns indicator to see every supported pattern on one chart and choose which ones to display in its settings.
- Trend filter: In the indicator settings, choose how the prior trend is detected (based on SMA 50, or SMA 50 and SMA 200), or turn trend detection off.
- Alerts: Create an alert on the indicator to get notified when a new pattern forms.
Understanding the bullish Rising window
The bullish Rising window is a two-candle continuation pattern in which the low of the second candle is above the high of the first, leaving a gap during an uptrend. It shows strong buying and may signal that the uptrend will continue, with the window often acting as support. Traders usually confirm it with volume, the behavior of later pullbacks, and the wider trend before acting on it.