Percentage Price Oscillator (PPO)
The Percentage Price Oscillator (PPO) is a momentum indicator that measures the relative difference between two moving averages. Similar to the MACD indicator, the PPO consists of three components: the main oscillator, a smoothed signal line, and a histogram line that represents the difference between those values.
While the MACD indicator measures the difference between two moving averages in absolute price units, the PPO expresses the difference between two averages as a percentage of the slower average. The PPO is thus a relative measure that is less sensitive to the actual scale of price changes, offering more consistency for comparing momentum across history or across securities.
Traders often use the PPO in a similar way to the MACD: to analyze short-term momentum, identify mean reversion or trends, and spot divergences or other patterns.
Calculation
The formula of the PPO closely resembles that of the MACD. The only difference is that the PPO computes the percentage distance from the slower average to the faster average, for a more consistent scale across time. The calculation is as follows:
PPO = (Fast MA − Slow MA) / Slow MA × 100Signal = Moving average of PPOHistogram = PPO − SignalWhere:
- Fast MA is the moving average with the lowest length
- Slow MA is the moving average with the highest length
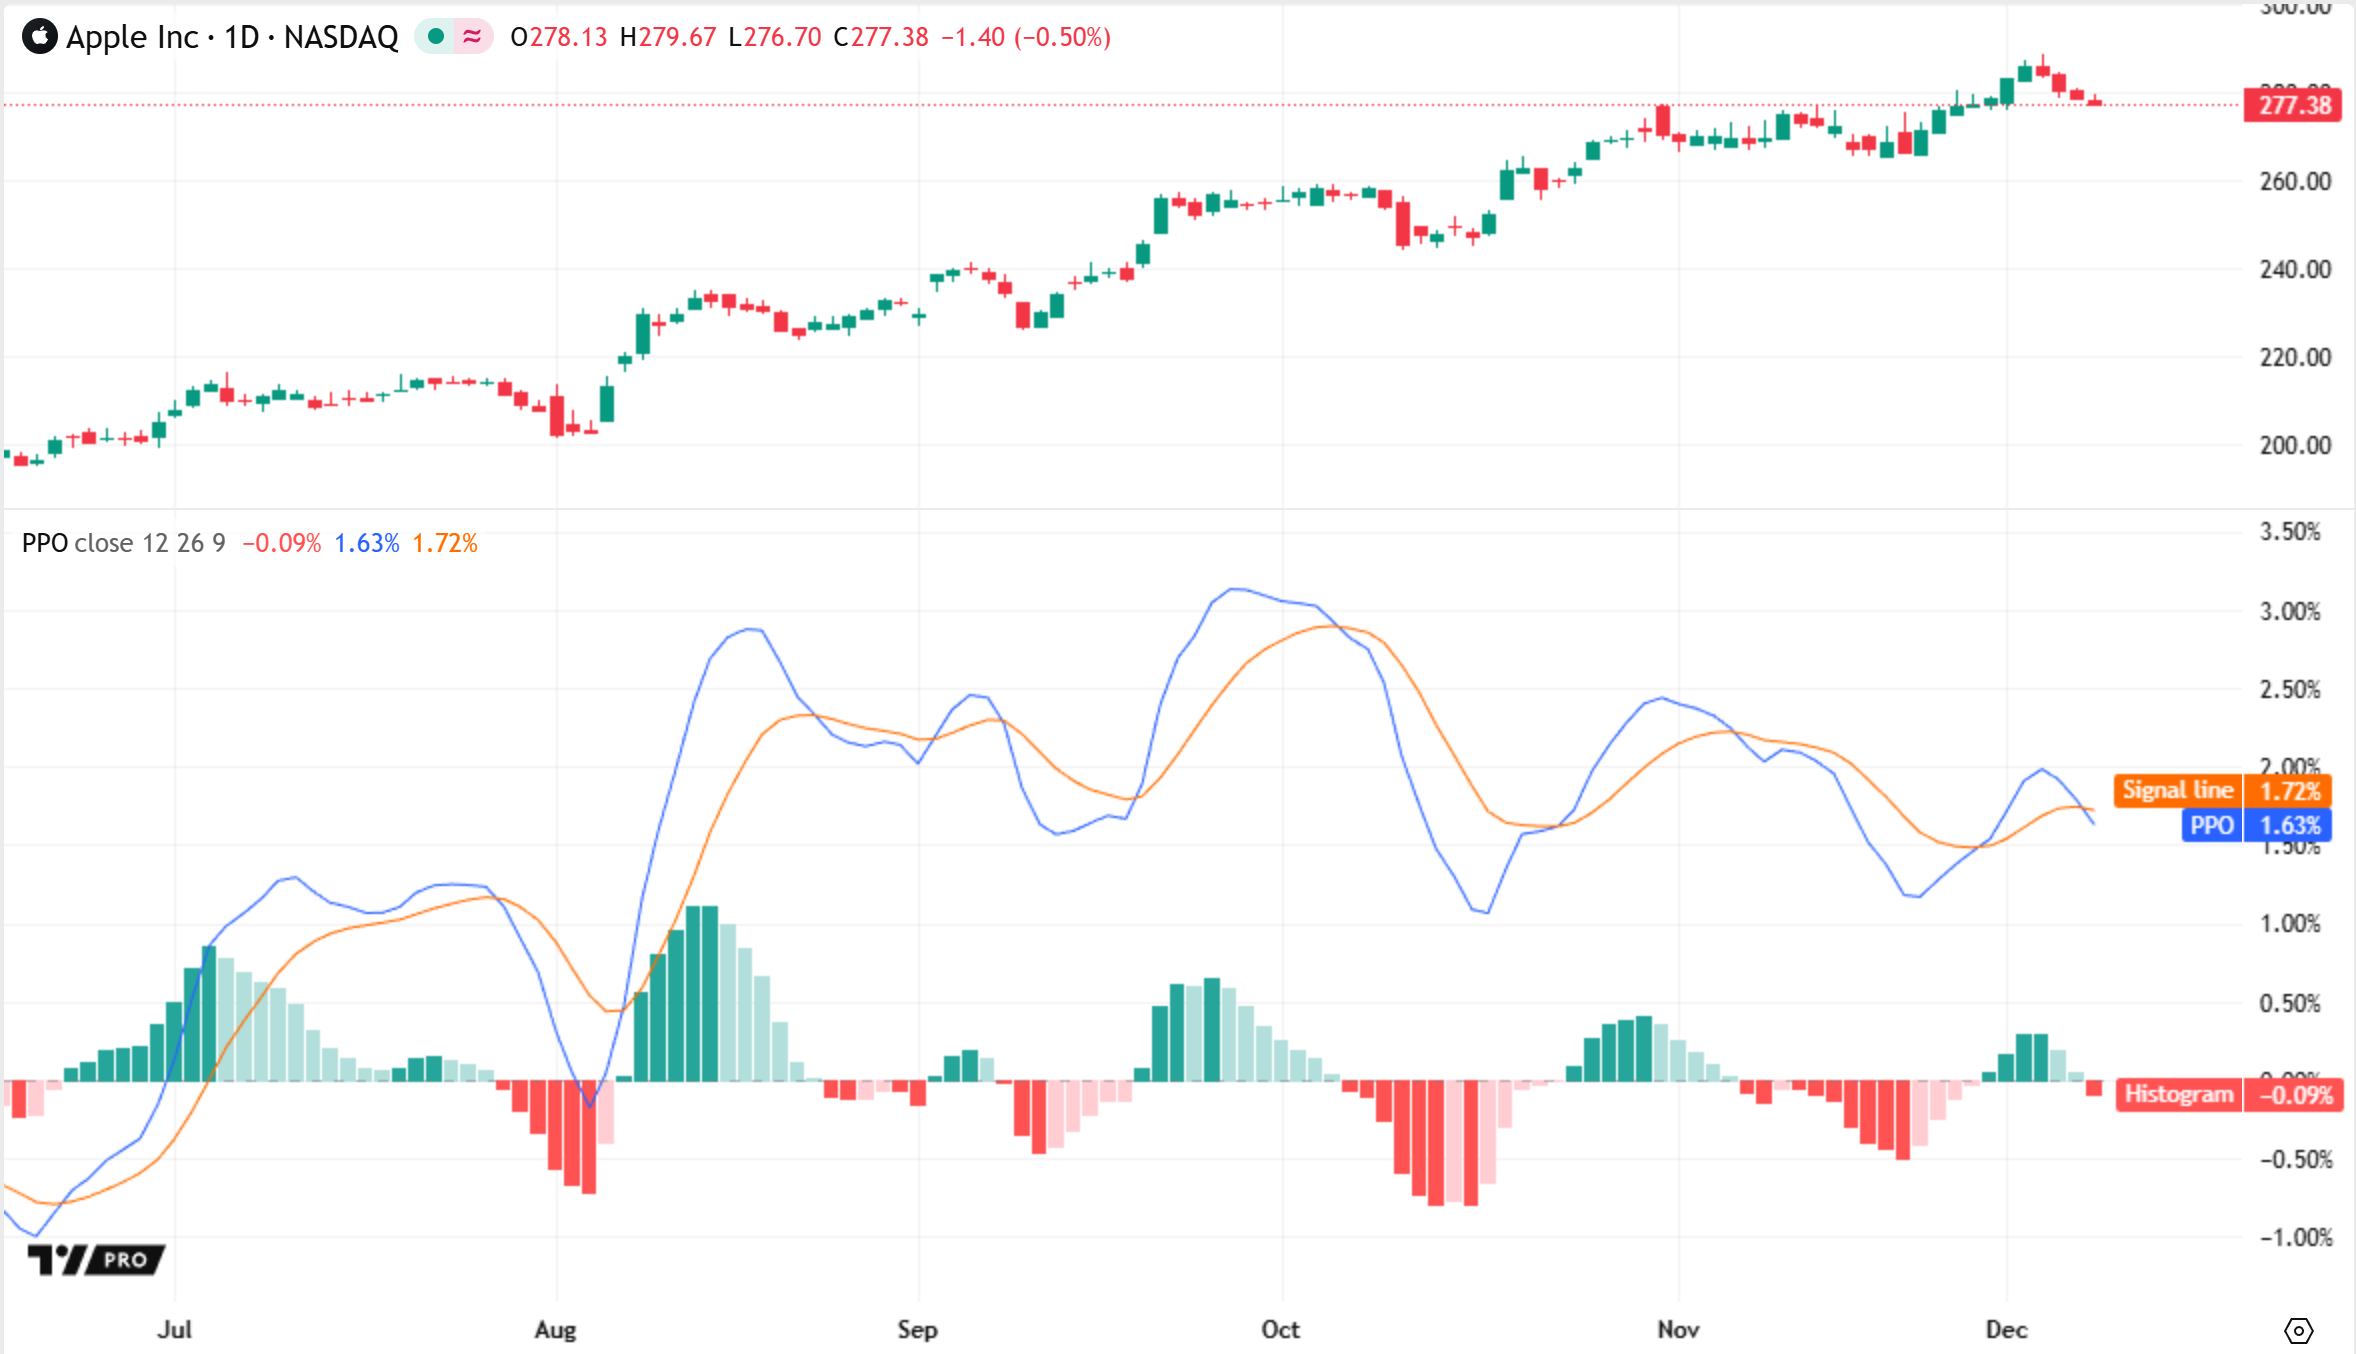
The indicator plots the PPO and signal values as lines, and the histogram values as color-coded columns. It also displays a horizontal zero line to distinguish positive and negative values.
The typical interpretation of the indicator is similar to that of the MACD:
- A PPO value above 0 indicates that the fast MA is greater than the slow MA, suggesting average upward momentum or a potential uptrend. A PPO value below 0 indicates the opposite.
- A histogram value above 0, or the PPO moving above the signal line, suggests that upward momentum is increasing or downward momentum is decreasing. A histogram value below 0 or the PPO moving below the signal line suggests the opposite.
- Divergences between PPO and price movements might help to identify turning points or shifts in trends. For example, falling peaks in the PPO while the price rises might signal the exhaustion of an uptrend, while rising dips in the PPO as the price falls might signal the exhaustion of a downtrend.
- Divergences between the PPO and the histogram can indicate changes in short-term momentum. For example, falling histogram values as the PPO rises might suggest that upward momentum is weakening, while rising histogram values as the PPO falls might suggest that downward momentum is weakening.
Inputs

Source
The series of values for which to calculate the oscillator.
Fast length
The length value for the fast moving average.
Slow length
The length value for the slow moving average.
Signal length
The length value for the moving average of the PPO (signal line).
Oscillator MA type
Specifies the type for the fast and slow averages in the PPO calculation. Select "EMA" to use two exponential moving averages, or "SMA" to use simple moving averages instead.
Signal MA type
Specifies which type of moving average the indicator applies to the PPO to calculate the signal line. Select "EMA" for an exponential moving average, or "SMA" for a simple moving average.
Timeframe
Sets the timeframe that the indicator uses for its calculations. The "Wait for timeframe closes" checkbox below determines whether the indicator shows results only when a bar on the specified timeframe closes. See the Leveraging multi-timeframe analysis article to learn more.