Weis Wave Volume NumbersWhat is it?
This is an indicator to complement @modhelius' Weis Wave Volume Indicator.
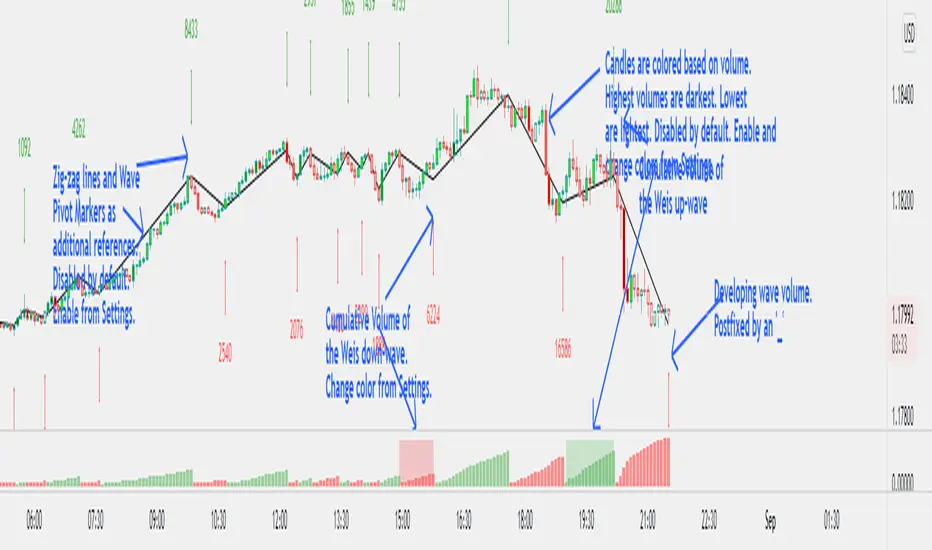
Original code has been modified to display wave volume (cumulative) numbers above or below the latest candle of the corresponding wave on the main pane. Since we are concerned only with relative volume, VOLUME NUMBERS HAVE BEEN SCALED DOWN. (If you need actual volume numbers, uncheck "Scale Down Volume" option in Settings). Rising wave volume is denoted in green. Falling wave volume is denoted in red. Developing wave volume is postfixed with a '_'. Confirmed wave volumes won't have this.
Who is it for?
This indicator is useful if you already use Weis Waves in your analysis and could do with an additional numerical representation of the wave volume on the main pane. Can be used in conjunciton with @modhelius' Weis Wave Volume (WWV) indicator (need to be added separately) to complement the visual representation of the waves. Can be used independently as well.
Pelase note that if you use any other Weis Wave indicator (other than @modhelius'), the numbers and the waveforms might not match.
Weisswave
[SignalFI] VolumeFI (Weiss Wave)
VolumeFI uses our proprietary DynaFIB EMA Moving average to create a unified volume trend that leverages Weiss Wave mechanics. There are a few items to note with the use of this tool:
1) The Volume wave created can be customized, becoming more sensitive if the EMA Length is changed in the settings. By default the value is 6, and I would not go below 3 or above 9 for this setting to remain relevant to the trend.
2) By default background coloring is disabled. If enabled, the background color of the indicator will correspond to the trend squares that are presented at the top of the Wave bars. This does not show any additional functionality other than presenting the Rising and Falling effect of volume in a more pronounced way. This is simply to please some traders that would like a more "obvious" representation of the current trend presented by VolumeFI.
3) Small up and down labels are presented which indicate bull and bear volume spikes. These signals can be categorized into to two forms. When the signal presents itself at the start or in the middle of trend, the signal can be considered "supportive" of the trend. When the signal presents itself at the "top" or "bottom" of a trend (based on other confluence), it can be interpreted as "non-supportive" of the trend.
Said another simpler way, the small up/down labels represents impulses of positive trend supporting volume, or can indicate "exhaustion" of the trend when seen after a longer volume wave.
These bars can also provide notice of a reversal when opposite colored signals are presented on Volume Wave bars. When you see a "Blue" (Bull) volume spike on a red wave, and in succession that would indicate that volume is attempting to reverse the downward trend. The same goes for multiple "Red" (Bear) volume spikes seen on a blue wave.

Weis zig zag dark background JayyThis is the same as but for dark backgrounds. Unfortunately, adding color choices for the numbers puts the script over the Tradingview 64 plot limit. Please read the notes for updates at the linked script above.
Also, check out Be sure to watch the videos at both sites to understand how to use the scripts.
