Elliott Wave Full Fractal System v2.0Elliott Wave Full Fractal System v2.0 – Q.C. FINAL (Guaranteed R/R)
Elliott Wave Full Fractal System is a multi-timeframe wave engine that automatically labels Elliott impulses and ABC corrections, then builds a rule-based, ATR-driven risk/reward framework around the “W3–W4–W5” leg.
“Guaranteed R/R” here means every order is placed with a predefined stop-loss and take-profit that respect a minimum Reward:Risk ratio – it does not mean guaranteed profits.
Core Idea
This strategy turns a full fractal Elliott Wave labelling engine into a systematic trading model.
It scans fractal pivots on three wave degrees (Primary, Intermediate, Minor) to detect 5-wave impulses and ABC corrections.
A separate “Trading Degree” pivot stream, filtered by a 200-EMA trend filter and ATR-based dynamic pivots, is then used to find W4 pullback entries with a minimum, user-defined Reward:Risk ratio.
Default Properties & Risk Assumptions
The backtest uses realistic but conservative defaults:
// Default properties used for backtesting
strategy(
"Elliott Wave Full Fractal System - Q.C. FINAL (Guaranteed R/R)",
overlay = true,
initial_capital = 10000, // realistic account size
default_qty_type = strategy.percent_of_equity,
default_qty_value = 1, // 1% risk per trade
commission_type = strategy.commission.cash_per_contract,
commission_value = 0.005, // example stock commission
slippage = 0 // see notes below
)
Account size: 10,000 (can be changed to match your own account).
Position sizing: 1% of equity per trade to keep risk per idea sustainable and aligned with TradingView’s recommendations.
Commission: 0.005 cash per contract/share as a realistic example for stock trading.
Slippage: set to 0 in code for clarity of “pure logic” backtesting. Real-life trading will experience slippage, so users should adjust this according to their market and broker.
Always re-run the backtest after changing any of these values, and avoid using high risk fractions (5–10%+) as that is rarely sustainable.
1. Full Fractal Wave Engine
The script builds and maintains four pivot streams using ATR-adaptive fractals:
Primary Degree (Macro Trend):
Captures the large swings that define the major trend. Labels ①–⑤ and ⒶⒷⒸ using blue “Circle” labels and thicker lines.
Intermediate Degree (Trading Degree):
Captures the medium swings (swing-trading horizon). Uses teal labels ( (1)…(5), (A)(B)(C) ).
Minor Degree (Micro Structure):
Tracks short-term swings inside the larger waves. Uses red roman numerals (i…v, a b c).
ABC Corrections (Optional):
When enabled, the engine tries to detect standard A–B–C corrective structures that follow a completed 5-wave impulse and plots them with dashed lines.
Each degree uses a dynamic pivot lookback that expands when ATR is above its EMA, so the system naturally requires “stronger” pivots in volatile environments and reacts faster in quiet conditions.
2. Theory Rules & Strict Mode
Normal Mode: More permissive detection. Designed to show more wave structures for educational / exploratory use.
Strict Mode: Enforces key Elliott constraints:
Wave 3 not shorter than waves 1 and 5.
No invalid W4 overlap with W1 (for standard impulses).
ABC Logic: After a confirmed bullish impulse, the script expects a down-up-down corrective pattern (A,B,C). After a bearish impulse, it looks for up-down-up.
3. Trend Filter & Pivots
EMA Trend Filter: A configurable EMA (default 200) is used as a non-wave trend filter.
Price above EMA → Only long setups are considered.
Price below EMA → Only short setups are considered.
ATR-Adaptive Pivots: The pivot engine scales its left/right bars based on current ATR vs ATR EMA, making waves and trading pivots more robust in volatile regimes.
4. Dynamic Risk Management (Guaranteed R/R Engine)
The trading engine is designed around risk, not just pattern recognition:
ATR-Based Stop:
Stop-loss is placed at:
Entry ± ATR × Multiplier (user-configurable, default 2.0).
This anchors risk to current volatility.
Minimum Reward:Risk Ratio:
For each setup, the script:
Computes the distance from entry to stop (risk).
Projects a take-profit target at risk × min_rr_ratio away from entry.
Only accepts the setup if risk is positive and the required R:R ratio is achievable.
Result: Every order is created with both TP and SL at a predefined distance, so each trade starts with a known, minimum Reward:Risk profile by design.
“Guaranteed R/R” refers exclusively to this order placement logic (TP/SL geometry), not to win-rate or profitability.
5. Trading Logic – W3–W4–W5 Pattern
The Trading pivot stream (separate from visual wave degrees) looks for a simple but powerful pattern:
Bullish structure:
Sequence of pivots forms a higher-high / higher-low pattern.
Price is above the EMA trend filter.
A strong “W3” leg is confirmed with structure rules (optionally stricter in Strict mode).
Entry (Long – W4 Pullback):
The “height” of W3 is measured.
Entry is placed at a configurable Fibonacci pullback (default 50%) inside that leg.
ATR-based stop is placed below entry.
Take-profit is projected to satisfy min Reward:Risk.
Bearish structure:
Mirrored logic (lower highs/lows, price below EMA, W3 down, W4 retrace up, W5 continuation down).
Once a valid setup is found, the script draws a colored box around the entry zone and a label describing the type of signal (“LONG SETUP” or “SHORT SETUP”) with the suggested limit price.
6. Orders & Execution
Entry Orders: The strategy uses limit orders at the computed W4 level (“Sniper Long” or “Sniper Short”).
Exits: A single strategy.exit() is attached to each entry with:
Take-profit at the projected minimum R:R target.
Stop-loss at ATR-based level.
One Trade at a Time: New setups are only used when there is no open position (strategy.opentrades == 0) to keep the logic clear and risk contained.
7. Visual Guide on the Chart
Wave Labels:
Primary: ①,②,③,④,⑤, ⒶⒷⒸ
Intermediate: (1)…(5), (A)(B)(C)
Minor: i…v, a b c
Trend EMA: Single blue EMA showing the dominant trend.
Setup Boxes:
Green transparent box → long entry zone.
Red transparent box → short entry zone.
Labels: “LONG SETUP / SHORT SETUP” labels mark the proposed limit entry with price.
8. How to Use This Strategy
Attach the strategy to your chart
Choose your market (stocks, indices, FX, crypto, futures, etc.) and timeframe (for example 1h, 4h, or Daily). Then add the strategy to the chart from your Scripts list.
Start with the default settings
Leave all inputs on their defaults first. This lets you see the “intended” behaviour and the exact properties used for the published backtest (account size, 1% risk, commission, etc.).
Study the wave map
Zoom in and out and look at the three wave degrees:
Blue circles → Primary degree (big picture trend).
Teal (1)…(5) → Intermediate degree (swing structure).
Red i…v → Minor degree (micro waves).
Use this to understand how the engine is interpreting the Elliott structure on your symbol.
Watch for valid setups
Look for the coloured boxes and labels:
Green box + “LONG SETUP” label → potential W4 pullback long in an uptrend.
Red box + “SHORT SETUP” label → potential W4 pullback short in a downtrend.
Only trades in the direction of the EMA trend filter are allowed by the strategy.
Check the Reward:Risk of each idea
For each setup, inspect:
Limit entry price.
ATR-based stop level.
Projected take-profit level.
Make sure the minimum Reward:Risk ratio matches your own rules before you consider trading it.
Backtest and evaluate
Open the Strategy Tester:
Verify you have a decent sample size (ideally 100+ trades).
Check drawdowns, average trade, win-rate and R:R distribution.
Change markets and timeframes to see where the logic behaves best.
Adapt to your own risk profile
If you plan to use it live:
Set Initial Capital to your real account size.
Adjust default_qty_value to a risk level you are comfortable with (often 0.5–2% per trade).
Set commission and slippage to realistic broker values.
Re-run the backtest after every major change.
Use as a framework, not a signal machine
Treat this as a structured Elliott/R:R framework:
Filter signals by higher-timeframe trend, major S/R, volume, or fundamentals.
Optionally hide some wave degrees or ABC labels if you want a cleaner chart.
Combine the system’s structure with your own trade management and discretion.
Best Practices & Limitations
This is an approximate Elliott Wave engine based on fractal pivots. It does not replace a full discretionary Elliott analysis.
All wave counts are algorithmic and can differ from a manual analyst’s interpretation.
Like any backtest, results depend heavily on:
Symbol and timeframe.
Sample size (more trades are better).
Realistic commission/slippage settings.
The 0-slippage default is chosen only to show the “raw logic”. In real markets, slippage can significantly impact performance.
No strategy wins all the time. Losing streaks and drawdowns will still occur even with a strict R:R framework.
Disclaimer
This script is for educational and research purposes only and does not constitute financial advice or a recommendation to buy or sell any security. Past performance, whether real or simulated, is not indicative of future results. Always test on multiple symbols/timeframes, use conservative risk, and consult your financial advisor before trading live capital.
การวิเคราะห์คลื่น

ChronoPulse MS-MACD Resonance StrategyChronoPulse MS-MACD Resonance Strategy
A systematic trading strategy that combines higher-timeframe market structure analysis with dual MACD momentum confirmation, ATR-based risk management, and real-time quality assurance monitoring.
Core Principles
The strategy operates on the principle of multi-timeframe confluence, requiring agreement between:
Market structure breaks (CHOCH/BOS) on a higher timeframe
Dual MACD momentum confirmation (classic and crypto-tuned profiles)
Trend alignment via directional EMAs
Volatility and volume filters
Quality score composite threshold
Strategy Components
Market Structure Engine : Detects Break of Structure (BOS) and Change of Character (CHOCH) events using confirmed pivots on a configurable higher timeframe. Default structure timeframe is 240 minutes (4H).
Dual MACD Fusion : Requires agreement between two MACD configurations:
Classic MACD: 12/26/9 (default)
Fusion MACD: 8/21/5 (default, optimized for crypto volatility)
Both must agree on direction before trade execution. This can be disabled to use single MACD confirmation.
Trend Alignment : Uses two EMAs for directional bias:
Directional EMA: 55 periods (default)
Execution Trend Guide: 34 periods (default)
Both must align with trade direction.
ATR Risk Management : All risk parameters are expressed in ATR multiples:
Stop Loss: 1.5 × ATR (default)
Take Profit: 3.0 × ATR (default)
Trail Activation: 1.0 × ATR profit required (default)
Trail Distance: 1.5 × ATR behind price (default)
Volume Surge Filter : Optional gate requiring current volume to exceed a multiple of the volume SMA. Default threshold is 1.4× the 20-period volume SMA.
Quality Score Gate : Composite score (0-1) combining:
Structure alignment (0.0-1.0)
Momentum strength (0.0-1.0)
Trend alignment (0.0-1.0)
ATR volatility score (0.0-1.0)
Volume intensity (0.0-1.0)
Default threshold: 0.62. Trades only execute when quality score exceeds this threshold.
Execution Discipline : Trade budgeting system:
Maximum trades per session: 6 (default)
Cooldown bars between entries: 5 (default)
Quality Assurance Console : Real-time monitoring panel displaying:
Structure status (pass/fail)
Momentum confirmation (pass/fail)
Volatility readiness (pass/fail)
Quality score (pass/fail)
Discipline compliance (pass/fail)
Performance metrics (win rate, profit factor)
Net PnL
Certification requires: Win Rate ≥ 40%, Profit Factor ≥ 1.4, Minimum 25 closed trades, and positive net profit.
Integrity Suite : Optional validation panel that audits:
Configuration sanity checks
ATR data readiness
EMA hierarchy validity
Performance realism checks
Strategy Settings
strategy(
title="ChronoPulse MS-MACD Resonance Strategy",
shorttitle="ChronPulse",
overlay=true,
max_labels_count=500,
max_lines_count=500,
initial_capital=100000,
currency=currency.USD,
pyramiding=0,
commission_type=strategy.commission.percent,
commission_value=0.015,
slippage=2,
default_qty_type=strategy.percent_of_equity,
default_qty_value=2.0,
calc_on_order_fills=true,
calc_on_every_tick=true,
process_orders_on_close=true
)
Key Input Parameters
Structure Timeframe : 240 (4H) - Higher timeframe for structure analysis
Structure Pivot Left/Right : 3/3 - Pivot confirmation periods
Structure Break Buffer : 0.15% - Buffer for structure break confirmation
MACD Fast/Slow/Signal : 12/26/9 - Classic MACD parameters
Fusion MACD Fast/Slow/Signal : 8/21/5 - Crypto-tuned MACD parameters
Directional EMA Length : 55 - Primary trend filter
Execution Trend Guide : 34 - Secondary trend filter
ATR Length : 14 - ATR calculation period
ATR Stop Multiplier : 1.5 - Stop loss in ATR units
ATR Target Multiplier : 3.0 - Take profit in ATR units
Trail Activation : 1.0 ATR - Profit required before trailing
Trail Distance : 1.5 ATR - Distance behind price
Volume Threshold : 1.4× - Volume surge multiplier
Quality Threshold : 0.62 - Minimum quality score (0-1)
Max Trades Per Session : 6 - Daily trade limit
Cooldown Bars : 5 - Bars between entries
Win-Rate Target : 40% - Minimum for QA certification
Profit Factor Target : 1.4 - Minimum for QA certification
Minimum Trades for QA : 25 - Required closed trades
Signal Generation Logic
A trade signal is generated when ALL of the following conditions are met:
Higher timeframe structure shows bullish (CHOCH/BOS) or bearish structure break
Both MACD profiles agree on direction (if fusion enabled)
Price is above both EMAs for longs (below for shorts)
ATR data is ready and above minimum threshold
Volume exceeds threshold × SMA (if volume gate enabled)
Quality score ≥ quality threshold
Trade budget available (under max trades per day)
Cooldown period satisfied
Risk Management
Stop loss and take profit are set immediately on entry
Trailing stop activates after 1.0 ATR of profit
Trailing stop maintains 1.5 ATR distance behind highest profit point
Position sizing uses 2% of equity per trade (default)
No pyramiding (single position per direction)
Limitations and Considerations
The strategy requires sufficient historical data for higher timeframe structure analysis
Quality gate may filter out many potential trades, reducing trade frequency
Performance metrics are based on historical backtesting and do not guarantee future results
Commission and slippage assumptions (0.015% + 2 ticks) may vary by broker
The strategy is optimized for trending markets with clear structure breaks
Choppy or ranging markets may produce false signals
Crypto markets may require different parameter tuning than traditional assets
Optimization Notes
The strategy includes several parameters that can be tuned for different market conditions:
Quality Threshold : Lower values (0.50-0.60) allow more trades but may reduce average quality. Higher values (0.70+) are more selective but may miss opportunities.
Structure Timeframe : Use 240 (4H) for intraday trading, Daily for swing trading, Weekly for position trading
Volume Gate : Disable for low-liquidity pairs or when volume data is unreliable
Dual MACD Fusion : Disable for mean-reverting markets where single MACD may be more responsive
Trade Discipline : Adjust max trades and cooldown based on your risk tolerance and market volatility
Non-Repainting Guarantee
All higher timeframe data requests use lookahead=barmerge.lookahead_off to prevent repainting. Pivot detection waits for full confirmation before registering structure breaks. All visual elements (tables, labels) update only on closed bars.
Alerts
Three alert conditions are available:
ChronoPulse Long Setup : Fires when all long entry conditions are met
ChronoPulse Short Setup : Fires when all short entry conditions are met
ChronoPulse QA Certification : Fires when Quality Assurance console reaches CERTIFIED status
Configure alerts with "Once Per Bar Close" delivery to match the non-repainting design.
Visual Elements
Structure Labels : CHOCH↑, CHOCH↓, BOS↑, BOS↓ markers on structure breaks
Directional EMA : Orange line showing trend bias
Trailing Stop Lines : Green (long) and red (short) trailing stop levels
Dashboard Panel : Real-time status display (structure, MACD, ATR, quality, PnL)
QA Console : Quality assurance monitoring panel
Integrity Suite Panel : Optional validation status display
Recommended Usage
Forward test with paper trading before live deployment
Monitor the QA console until it reaches CERTIFIED status
Adjust parameters based on your specific market and timeframe
Respect the trade discipline limits to avoid over-trading
Review quality scores and adjust threshold if needed
Use appropriate commission and slippage settings for your broker
Technical Implementation
The strategy uses Pine Script v6 with the following key features:
Multi-timeframe data requests with lookahead protection
Confirmed pivot detection for structure analysis
Dynamic trailing stop management
Real-time quality score calculation
Trade budgeting and cooldown enforcement
Comprehensive dashboard and monitoring panels
All source code is open and available for review and modification.
Disclaimer
This script is for educational and informational purposes only. It is not intended as financial, investment, or trading advice. Past performance does not guarantee future results. Trading involves substantial risk of loss and is not suitable for all investors. Always conduct your own research and consult with a qualified financial advisor before making any trading decisions. The author and TradingView are not responsible for any losses incurred from using this strategy.

ATR ZigZag BreakoutATR ZigZag Breakout
This strategy uses my ATR ZigZag indicator (powered by the ZigZagCore library) to scalp breakouts at volatility-filtered highs and lows.
Everyone knows stops cluster around clear swing highs and lows. Breakout traders often pile in there, too. These levels are predictable areas where aggressive orders hit the tape. The idea here is simple:
→ Let ATR ZigZag define clean, volatility-filtered pivots
→ Arm a stop market order at those pivots
→ Join the breakout when the crowd hits the level
The key to greater success in this simple strategy lies in the ZigZag. Because the pivots are filtered by ATR instead of fixed bar counts or fractals, the levels tend to be more meaningful and less noisy.
This approach is especially suited for intraday trading on volatile instruments (e.g., NQ, GC, liquid crypto pairs).
How It Works
1. Pivot detection
The ATR ZigZag uses an ATR-based threshold to confirm swing highs and lows. Only when price has moved far enough in the opposite direction does a pivot become “official.”
2. Candidate breakout level
When a new swing direction is detected and the most recent high/low has not yet been broken in the current leg, the strategy arms a stop market order at that pivot.
• Long candidate → most recent swing high
• Short candidate → most recent swing low
These “candidate trades” are shown as dotted lines.
3. Entry, SL, and TP
If price breaks through the level, the stop order is filled and a bracket is placed:
• Stop loss = ATR × SL multiplier
• Take profit = SL distance × RR multiplier
Once a level has traded, it is not reused in the same swing leg.
4. Cancel & rotate
If the market reverses and forms a new swing in the opposite direction before the level is hit, the pending order is cancelled and a new candidate is considered in the new direction.
Additional Features
• Optional session filter for backtesting specific trading hours


Abdu Trading System Profit Pulse ProThis private indicator combines swing signals, overlays, trend tracing, and reversal zones.
It is an invite-only script and accessible only to authorized users.

Retracement Strategy [OmegaTools]Retracement Strategy is a systematic trend–retracement framework designed to identify directional opportunities after a confirmed momentum shift, and to manage exits using either trend reversals or overextension conditions. It is built around a smoothed RSI regime filter and a simple, price-based retracement trigger, making it applicable across a wide range of markets and timeframes while remaining transparent and easy to interpret.
The strategy begins by defining the underlying trend through a two-stage RSI signal. A standard RSI is computed over the user-defined Length input, then smoothed with a short moving average to reduce noise. Two symmetric thresholds are derived from the Threshold parameter: an upper band at 100 minus the threshold and a lower band at the threshold itself. When the smoothed RSI crosses above the upper band, the environment is classified as bullish and the internal trend state is set to uptrend. When the smoothed RSI crosses below the lower band, the environment is classified as bearish and the trend state becomes downtrend. When RSI moves back into the central zone between the two bands, the trend is considered neutral. In addition to the current trend, the strategy tracks the last non-neutral trend direction, which is used to detect genuine trend changes rather than transient oscillations.
Once a trend is established, the strategy looks for retracement entries in the direction of that trend. For long setups in an uptrend, it computes the lowest low over the previous Length minus one bars, excluding the current bar. A long signal is generated when price dips below this recent low while the trend state remains bullish. Symmetrically, for short setups in a downtrend, it computes the highest high over the previous Length minus one bars and enters short when price spikes above this recent high while the trend state remains bearish. This logic is designed to capture pullbacks against the prevailing RSI-defined trend, entering when the market tests or slightly violates recent extremes, rather than chasing breakouts. The candles are visually coloured to reflect the detected trend, highlighting bullish and bearish environments while keeping neutral phases distinguishable on the chart. An ATR-based measure is used solely to position the “UP” and “DN” labels on the chart for clearer visualisation of entry points; it does not directly influence position sizing or stop calculation in this implementation.
Take profit and stop loss behaviour are fully parameterized through the “Take Profit” and “Stop Loss” inputs, each offering three modes: None, Trend Change and Extension. When “Trend Change” is selected for the take profit, the strategy will only exit profitable positions when a confirmed trend reversal occurs. For a long position, this means that the strategy will close the trade when the trend state flips from uptrend to downtrend, and the last recorded trend direction validates that this is a genuine reversal rather than a neutral fluctuation; the same logic applies symmetrically for short positions. When “Extension” is selected as the take profit mode, the strategy closes profitable long trades when the smoothed RSI reaches or exceeds the upper threshold, interpreted as an overbought extension within the bullish regime, and closes profitable short trades when the smoothed RSI falls to or below the lower threshold, interpreted as an oversold extension within the bearish regime. When “None” is chosen, the strategy does not apply any explicit take profit logic, leaving trades to be managed by the stop loss settings or by user discretion in backtesting.
The stop loss parameter works in a parallel way. With “Trend Change” selected as stop loss, any open long position is closed when the trend flips from uptrend to downtrend, regardless of whether the trade is currently in profit or loss, and any open short is closed when the trend flips from downtrend to uptrend. This turns the RSI trend regime into a hard invalidation rule: once the underlying momentum structure reverses, the position is exited. With “Extension” selected for stop loss, long positions are closed when RSI falls back below the upper band and moves towards the opposite side of the range, while short positions are closed when RSI rises above the lower band and moves towards the upper side. In practice, this acts as a dynamic exit based on the oscillator moving out of a favourable context for the existing trade. Selecting “None” for stop loss disables these automatic exits, leaving only the take profit logic, if any, to manage the position. Because take profit and stop loss configuration are independent, the user can construct different profiles, such as pure trend-change exits on both sides, pure overextension exits, or a mix (for example, take profit on overextension and stop loss on trend reversal).
This strategy is designed as an analytical and backtesting framework rather than a finished plug-and-play trading system. It does not include position sizing, risk-per-trade controls, multi-timeframe confirmation, volatility filters or instrument-specific fine-tuning. Its primary purpose is to provide a clear, rule-based structure for testing retracement logic within RSI-defined trends, and to allow users to explore how different exit regimes (trend-change based versus extension based) affect performance on their instruments and timeframes of interest.
Nothing in this script or its description should be interpreted as financial advice, investment recommendation or solicitation to buy or sell any financial instrument. Past performance on backtests does not guarantee future results. The behaviour of this strategy can vary significantly across symbols, timeframes and market conditions, and correlations, volatility and liquidity can change without warning. Before considering any live application, users should thoroughly backtest and forward test the strategy on their own data, adjust parameters to their risk profile and instrument characteristics, and integrate proper money management and trade management rules. Use of this script is entirely at the user’s own risk.

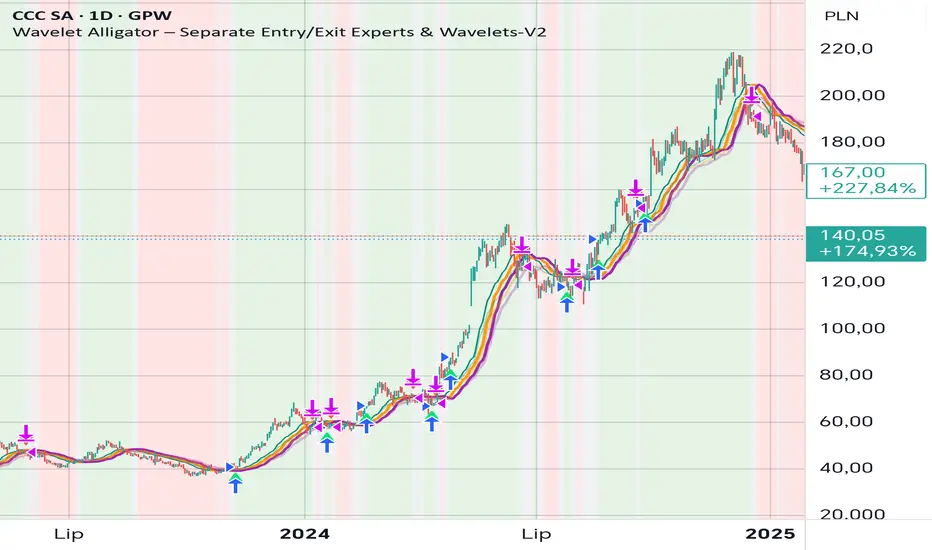
Wavelet Alligator – Separate Entry/Exit Experts & Wavelets-V2
Wavelet Alligator – Strategy Explanation & How to Use
1. Concept Overview
The Wavelet Alligator strategy combines:
- Wavelet transforms (Daubechies, Haar, Symlet, Mexican Hat, Morlet)
- Fractional calculus kernels: Caputo-Fabrizio (CF) and Atangana-Baleanu (AB)
- Three-layer “alligator-like” wavelet smoothing (soft → medium → strong)
- Expert-based entry/exit routing (RAW, CF, AB, or Majority vote)
- Independent wavelets for ENTRY and EXIT
- Main trend defined by AB wavelet ordering
This creates a multi-structure, multi-kernel trend engine capable of capturing extended moves with high signal quality.
2. Wavelet Alligator Structure
Each source (RAW, CF, AB) is transformed into three wavelet layers:
Soft = fastest reaction
Medium = mid smoothing
Strong = trend backbone
Wavelets:
- Daubechies: stable trend
- Haar: fast impulse detection
- Symlet: balanced
- Mexican Hat: curvature and reversal detection
- Morlet: cyclic, oscillatory
3. Entry Logic
Long entry occurs when:
- AB wavelet shows bullish structure (soft > medium > strong, medium rising)
- Selected entry expert approves (RAW / CF / AB / Majority)
- Wavelet condition: soft > strong AND medium crosses above strong
4. Exit Logic
Exit is independent from entry:
- Controlled by chosen exit expert
- Wavelet reversal condition: soft < strong AND medium crosses below strong
- Forced exit when AB trend turns neutral or bearish
5. Background Color (Regime)
- Green: bullish AB regime
- Red: bearish AB regime
- Gray: neutral/transition
6. How to Use
Step 1 – Choose entry wavelet
Daubechies: stable trend
Haar: breakout scalping
Mexican Hat: early reversals
Symlet: balanced
Morlet: cyclic markets
Step 2 – Choose exit wavelet
Mexican Hat: best precision
Daubechies: smooth exits
Haar: aggressive exits
Step 3 – Select entry/exit experts
CF only – fast fractional trend
AB only – stable long-memory trend
RAW only – pure price structure
Majority – safest, noise-filtered
Step 4 – Run the strategy
Entries occur only during AB bullish trend.
Exits occur on wavelet reversal or AB trend failure.
7. Why This Strategy Works
It fuses:
- Fractional calculus (memory)
- Wavelets (shape/curvature)
- Alligator ordering (trend hierarchy)
Result: high-quality entries, strong trend holding, noise-resistant signals.
Mirror Blocks: StrategyMirror Blocks is an educational structural-wave model built around a unique concept:
the interaction of mirrored weighted moving averages (“blocks”) that reflect shifts in market structure as price transitions between layered symmetry zones.
Rather than attempting to “predict” markets, the Mirror Blocks framework visualizes how price behaves when it expands away from, contracts toward, or flips across stacked WMA structures. These mirrored layers form a wave-like block system that highlights transitional zones in a clean, mechanical way.
This strategy version allows you to study how these structural transitions behave in different environments and on different timeframes.
The goal is understanding wave structure, not generating signals.
How It Works
Mirror Blocks builds three mirrored layers:
Top Block (Structural High Symmetry)
Base Block (Neutral Wave)
Bottom Block (Structural Low Symmetry)
The relative position of these blocks — and how price interacts with them — helps visualize:
Compression and expansion
Reversal zones
Wave stability
Momentum transitions
Structure flips
A structure is considered bullish-stack aligned when:
Top > Base > Bottom
and bearish-stack aligned when:
Bottom > Base > Top
These formations create the core of the Mirror Blocks wave engine.
What the Strategy Version Adds
This version includes:
Long Only, Short Only, or Long & Short modes
Adjustable symmetry distance (Mirror Distance)
Configurable WMA smoothing length
Optional trend filter using fast/slow MA comparison
ENTER / EXIT / LONG / SHORT labels for structural transitions
Fixed stop-loss controls for research
A clean, transparent structure with no hidden components
It is optimized for educational chart study, not automated signals.
Intended Purpose
Mirror Blocks is meant to help traders:
Study structural transitions
Understand symmetry-based wave models
Explore how price interacts with mirrored layers
Examine reversals and expansions from a mechanical perspective
Conduct long and short backtesting for research
Develop a deeper sense of market rhythm
This is not a prediction model.
It is a visual and structural framework for understanding movement.
Backtesting Disclaimer
Backtest results can vary depending on:
Slippage settings
Commission settings
Timeframe
Asset volatility
Structural sensitivity parameters
Past performance does not guarantee future results.
Use this as a research tool only.
Warnings & Compliance
This script is educational.
It is not financial advice.
It does not provide signals.
It does not promise profitability.
The purpose is to help visualize structure, not predict price.
The strategy features are simply here to help users study how structural transitions behave under various conditions.
License
Released under the Michael Culpepper Gratitude License (2025).
Use and modify freely for education and research with attribution.
No resale.
No promises of profitability.
Purpose is understanding, not signals.

Rasta Long/Short — StrategyThe Rasta Long/Short Strategy is a visual and educational framework designed to help traders study momentum shifts that appear when a fast EMA interacts with a slower smoothed baseline.
It is not a signal service. Instead, it is a research tool that helps you observe transitions, structure, and behavior across different market conditions and smoothing contexts.
The script plots:
A primary EMA line (fast reaction wave).
A Smoothed line (your chosen smoothing method).
Color-coded fog regions showing directional bias.
Optional DNA rung connections between the two lines for structural comparison.
Together, these allow a deeper study of how momentum pushes, volatility compression, expansions, and drift emerge around fast/slow EMA interactions.
✦ Core Idea
The Rasta Long/Short mechanism studies how price behaves when the fast EMA crosses above or below a smoothed anchor.
Rather than predicting price, it reveals where transitions occur across different structures, timeframes, and smoothing techniques.
The Long/Short logic simply highlights flips in directional structure.
It is not intended for real-time signals or automated execution; it is intended for understanding market movement.
✦ Smoothing Types (Explained)
The strategy allows experimenting with several smoothing families to observe how they transform the fast EMA:
SMA (Simple Moving Average)
Averaged, slower response. Good for stability comparisons.
EMA (Exponential)
Faster reaction, more responsive, smoother behavior during momentum.
RMA (Wilder’s)
Used in RSI calculations; steady, well-balanced response.
WMA (Weighted)
More weight to recent bars; bridges SMA and EMA dynamics.
None
Raw EMA vs EMA interaction with no secondary smoothing.
Each smoothing type provides unique structural information and can lead to different interpretations.
✦ Modes of Study
Designed for multi-timeframe research:
1H / 4H — Momentum flow mapping and structural identification.
Daily / Weekly — Higher-timeframe rotations, macro structure transitions.
1–15m — Microstructure studies, noise vs trend emergence.
Use the built-in Strategy Tester to explore entry/exit context, but treat results as research, not predictive performance.
✦ Components (Visual Study Tools)
EMA Line (Fast)
Primary reactive wave. Shows fast directional shifts.
Smoothed Line (Slow)
Trend baseline / reference structure.
Fog Region
Highlights fast-vs-smoothed directional alignment.
DNA Rungs (Optional)
Structural “bridges” showing the exact relationship between waves on each bar.
Useful for studying separation, compression, and expansions.
✦ Educational Insights
This strategy helps illuminate:
How fast and slow EMAs interact dynamically.
How structure changes precede trend emergence.
Where volatility compresses before expansion.
How noise, drift, and clean reversals differ.
How different smoothers alter the interpretation of the same price data.
The goal is clarity — not prediction.
✦ How to Use
Apply to any timeframe or instrument.
Enable or disable fog depending on preferred visibility.
Use DNA rungs for close structural comparison.
Observe long/short flips as educational reference points — not signals.
Study transitions visually, then backtest using the Strategy Tester for pattern research.
✦ Disclaimer
This script is provided for educational and research purposes only.
It does not provide trading signals, financial advice, or recommendations.
Past behavior does not indicate future performance.
Always practice risk-aware study and consult qualified financial professionals when needed.
✦ Author
Michael Culpepper (mikeyc747)
Creator of the Rasta framework and related market structure studies.

MaayaBullish_PROD_v14_Nov2025trying to analyses trend.
trying to analyses trend.
trying to analyses trend.
trying to analyses trend.
trying to analyses trend.
trying to analyses trend.
trying to analyses trend.
trying to analyses trend.

Quasimodo Pattern Strategy Back Test [TradingFinder] QM Trading🔵 Introduction
The QM pattern, also known as the Quasimodo pattern, is one of the popular patterns in price action, and it is often used by technical analysts. The QM pattern is used to identify trend reversals and provides a very good risk-to-reward ratio. One of the advantages of the QM pattern is its high frequency and visibility in charts.
Additionally, due to its strength, it is highly profitable, and as mentioned, its risk-to-reward ratio is very good. The QM pattern is highly popular among traders in supply and demand, and traders also use this pattern.
The Price Action QM pattern, like other Price Action patterns, has two types: Bullish QM and Bearish QM patterns. To identify this pattern, you need to be familiar with its types to recognize it.
🔵 Identifying the QM Pattern
🟣 Bullish QM
In the bullish QM pattern, as you can see in the image below, an LL and HH are formed. As you can see, the neckline is marked as a dashed line. When the price reaches this range, it will start its upward movement.
🟣 Bearish QM
The Price Action QM pattern also has a bearish pattern. As you can see in the image below, initially, an HH and LL are formed. The neckline in this image is the dashed line, and when the LL is formed, the price reaches this neckline. However, it cannot pass it, and the downward trend resumes.
🔵 How to Use
The Quasimodo pattern is one of the clearest structures used to identify market reversals. It is built around the concept of a structural break followed by a pullback into an area of trapped liquidity. Instead of relying on lagging indicators, this pattern focuses purely on price action and how the market reacts after exhausting one side of liquidity. When understood correctly, it provides traders with precise entry points at the transition between trend phases.
🟣 Bullish Quasimodo
A bullish Quasimodo forms after a clear downtrend when sellers start losing control. The market continues to make lower lows until a sudden higher high appears, signaling that buyers are entering with strength. Price then pulls back to retest the previous low, creating what is known as the Quasimodo low.
This area often becomes the final trap for sellers before the market shifts upward. A visible rejection or displacement from this zone confirms bullish momentum. Traders usually place entries near this level, stops below the low, and targets at previous highs or the next resistance zone. Combining the setup with demand zones or Fair Value Gaps increases its accuracy.
🟣 Bearish Quasimodo
A bearish Quasimodo forms near the top of an uptrend when buyers begin to lose strength. The market continues to make higher highs until a sudden lower low breaks the bullish structure, showing that selling pressure is entering the market. Price then retraces upward to retest the previous high, forming the Quasimodo high, where breakout buyers are often trapped.
Once rejection appears at this level, it indicates a likely reversal. Traders can enter short near this area, with stop-losses placed above the high and targets near the next support or previous lows. The setup gains more reliability when aligned with supply zones, SMT divergence, or bearish Fair Value Gaps.
🔵 Setting
Pivot Period : You can use this parameter to use your desired period to identify the QM pattern. By default, this parameter is set to the number 5.
Take Profit Mode : You can choose your desired Take Profit in three ways. Based on the logic of the QM strategy, you can select two Take Profit levels, TP1 and TP2. You can also choose your take profit based on the Reward to Risk ratio. You must enter your desired R/R in the Reward to Risk Ratio parameter.
Stop Loss Refine : The loss limit of the QM strategy is based on its logic on the Head pattern. You can refine it using the ATR Refine option to prevent Stop Hunt. You can enter your desired coefficient in the Stop Loss ATR Adjustment Coefficient parameter.
Reward to Risk Ratio : If you set Take Profit Mode to R/R, you must enter your desired R/R here. For example, if your loss limit is 10 pips and you set R/R to 2, your take profit will be reached when the price is 20 pips away from your entry point.
Stop Loss ATR Adjustment Coefficient : If you set Stop Loss Refine to ATR Refine, you must adjust your loss limit coefficient here. For example, if your buy position's loss limit is at the price of 1000, and your ATR is 10, if you set Stop Loss ATR Adjustment Coefficient to 2, your loss limit will be at the price of 980.
Entry Level Validity : Determines how long the Entry level remains valid. The higher the level, the longer the entry level will remain valid. By default it is 2 and it can be set between 2 and 15.
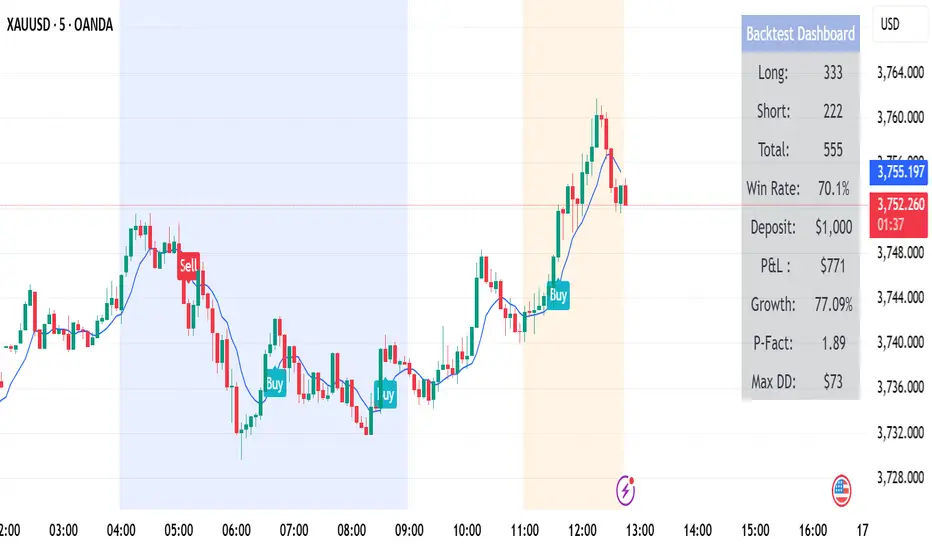
🔵 Results
The following examples show the backtest results of the Quasimodo (QM) strategy in action. Each image is based on specific settings for the symbol, timeframe, and input parameters, illustrating how the QM logic can generate signals under different market conditions. The detailed configuration for each backtest is also displayed on the image.
⚠ Important Note : Even with identical settings and the same symbol, results may vary slightly across different brokers due to data feed variations and pricing differences.
Default Properties of Backtests :
OANDA:XAUUSD | TimeFrame: 5min | Duration: 1 Year :
BINANCE:BTCUSD | TimeFrame: 5min | Duration: 1 Year :
CAPITALCOM:US30 | TimeFrame: 5min | Duration: 1 Year :
NASDAQ:QQQ | TimeFrame: 5min | Duration: 5 Year :
OANDA:EURUSD | TimeFrame: 5min | Duration: 5 Year :
PEPPERSTONE:US500 | TimeFrame: 5min | Duration: 5 Year :

RastaRasta — Educational Strategy (Pine v5)
Momentum · Smoothing · Trend Study
Overview
The Rasta Strategy is a visual and educational framework designed to help traders study momentum transitions using the interaction between a fast-reacting EMA line and a slower smoothed reference line.
It is not a signal generator or profit system; it’s a learning tool for understanding how smoothing, crossovers, and filters interact under different market conditions.
The script displays:
A primary EMA line (the fast reactive wave).
A Smoothed line (using your chosen smoothing method).
Optional fog zones between them for quick visual context.
Optional DNA rungs connecting both lines to illustrate volatility compression and expansion.
Optional EMA 8 / EMA 21 trend filter to observe higher-time-frame alignment.
Core Idea
The Rasta model focuses on wave interaction. When the fast EMA crosses above the smoothed line, it reflects a shift in short-term momentum relative to background trend pressure. Cross-unders suggest weakening or reversal.
Rather than treating this as a trading “signal,” use it to observe structure, study trend alignment, and test how smoothing type affects reaction speed.
Smoothing Types Explained
The script lets you experiment with multiple smoothing techniques:
Type Description Use Case
SMA (Simple Moving Average) Arithmetic mean of the last n values. Smooth and steady, but slower. Trend-following studies; filters noise on higher time frames.
EMA (Exponential Moving Average) Weights recent data more. Responds faster to new price action. Momentum or reactive strategies; quick shifts and reversals.
RMA (Relative Moving Average) Used internally by RSI; smooths exponentially but slower than EMA. Momentum confirmation; balanced response.
WMA (Weighted Moving Average) Linear weights emphasizing the most recent data strongly. Intraday scalping; crisp but potentially noisy.
None Disables smoothing; uses the EMA line alone. Raw comparison baseline.
Each smoothing method changes how early or late the strategy reacts:
Faster smoothing (EMA/WMA) = more responsive, good for scalping.
Slower smoothing (SMA/RMA) = more stable, good for trend following.
Modes of Study
🔹 Scalper Mode
Use short EMA lengths (e.g., 3–5) and fast smoothing (EMA or WMA).
Focus on 1 min – 15 min charts.
Watch how quick crossovers appear near local tops/bottoms.
Fog and rung compression reveal volatility contraction before bursts.
Goal: study short-term rhythm and liquidity pulses.
🔹 Momentum Mode
Use moderate EMA (5–9) and RMA smoothing.
Ideal for 1 H–4 H charts.
Observe how the fog color aligns with trend shifts.
EMA 8 / 21 filter can act as macro bias; “Enter” labels will appear only in its direction when enabled.
Goal: study sustained motion between pullbacks and acceleration waves.
🔹 Trend-Follower Mode
Use longer EMA (13–21) with SMA smoothing.
Great for daily/weekly charts.
Focus on periods where fog stays unbroken for long stretches — these illustrate clear trend dominance.
Watch rung spacing: tight clusters often precede consolidations; wide rungs signal expanding volatility.
Goal: visualize slow-motion trend transitions and filter whipsaw conditions.
Components
EMA Line (Red): Fast-reacting short-term direction.
Smoothed Line (Yellow): Reference trend baseline.
Fog Zone: Green when EMA > Smoothed (up-momentum), red when below.
DNA Rungs: Thin connectors showing volatility structure.
EMA 8 / 21 Filter (optional):
When enabled, the strategy will only allow Enter events if EMA 8 > EMA 21.
Use this to study higher-trend gating effects.
Educational Applications
Momentum Visualization: Observe how the fast EMA “breathes” around the smoothed baseline.
Trend Transitions: Compare different smoothing types to see how early or late reversals are detected.
Noise Filtering: Experiment with fog opacity and smoothing lengths to understand trade-off between responsiveness and stability.
Risk Concept Simulation: Includes a simple fixed stop-loss parameter (default 13%) for educational demonstrations of position management in the Strategy Tester.
How to Use
Add to Chart → “Strategy.”
Works on any timeframe and instrument.
Adjust Parameters:
Length: base EMA speed.
Smoothing Type: choose SMA, EMA, RMA, or WMA.
Smoothing Length: controls delay and smoothness.
EMA 8 / 21 Filter: toggles trend gating.
Fog & Rungs: visual study options only.
Study Behavior:
Use Strategy Tester → List of Trades for entry/exit context.
Observe how different smoothing types affect early vs. late “Enter” points.
Compare trend periods vs. ranging periods to evaluate efficiency.
Combine with External Tools:
Overlay RSI, MACD, or Volume for deeper correlation analysis.
Use replay mode to visualize crossovers in live sequence.
Interpreting the Labels
Enter: Marks where fast EMA crosses above the smoothed line (or when filter flips positive).
Exit: Marks where fast EMA crosses back below.
These are purely analytical markers — they do not represent trade advice.
Educational Value
The Rasta framework helps learners explore:
Reaction time differences between moving-average algorithms.
Impact of smoothing on signal clarity.
Interaction of local and global trends.
Visualization of volatility contraction (tight DNA rungs) and expansion (wide fog zones).
It’s a sandbox for studying price structure, not a promise of profit.
Disclaimer
This script is provided for educational and research purposes only.
It does not constitute financial advice, trading signals, or performance guarantees. Past market behavior does not predict future outcomes.
Users are encouraged to experiment responsibly, record observations, and develop their own understanding of price behavior.
Author: Michael Culpepper (mikeyc747)
License: Educational / Open for study and modification with credit.
Philosophy:
“Learning the rhythm of the market is more valuable than chasing its profits.” — Rasta

Sigma Trinity ModelAbstract
Sigma Trinity Model is an educational framework that studies how three layers of market behavior interact within the same trend: (1) structural momentum (Rasta), (2) internal strength (RSI), and (3) continuation/compounding structure (Pyramid). The model deliberately combines bar-close momentum logic with intrabar, wick-aware strength checks to help users see how reversals form, confirm, and extend. It is not a signal service or automation tool; it is a transparent learning instrument for chart study and backtesting.
Why this is not “just a mashup”
Many scripts merge indicators without explaining the purpose. Sigma Trinity is a coordinated, three-engine study designed for a specific learning goal:
Rasta (structure): defines when momentum actually flips using a dual-line EMA vs smoothed EMA. It gives the entry/exit framework on bar close for clean historical study.
RSI (energy): measures internal strength with wick-aware triggers. It uses RSI of LOW (for bottom touches/reclaims) and RSI of HIGH (for top touches/exhaustion) so users can see intrabar strength/weakness that the close can hide.
Pyramid (progression): demonstrates how continuation behaves once momentum and strength align. It shows the logic of adds (compounding) as a didactic layer, also on bar close to keep historical alignment consistent.
These three roles are complementary, not redundant: structure → strength → progression.
Architecture Overview
Execution model
Rasta & Pyramid: bar close only by default (historically stable, easy to audit).
RSI: per tick (realtime) with bar-close backup by default, using RSI of LOW for entries and RSI of HIGH for exits. This makes the module sensitive to intra-bar wicks while still giving a close-based safety net for backtests.
Stops (optional in strategy builds): wick-accurate: trail arms/ratchets on HIGH; stop hit checks with LOW (or Close if selected) with a small undershoot buffer to avoid micro-noise hits.
Visual model
Dual lines (EMA vs smoothed EMA) for Rasta + color fog to see direction and compression/expansion.
Rungs (small vertical lines) drawn between the two Rasta lines to visualize wave spacing and rhythm.
Clean labels for Entry/Exit/Pyramid Add/RSI events. Everything is state-locked to avoid spamming.
Module 1 — Rasta (Structural Momentum Layer)
Goal: Identify structural momentum reversals and maintain a consistent, replayable backbone for study.
Method:
Compute an EMA of a chosen price source (default Close), and a smoothed version (SMA/EMA/RMA/WMA/None selectable).
Flip points occur when the EMA line crosses the smoothed line.
Optional EMA 8/21 trend filter can gate entries (long-bias when EMA8 > EMA21). A small “adaptive on flip” option lets an entry fire when the filter itself flips to ON and the EMA is already above the smoothed line—useful for trend resumption.
Why bar close only?
Bar-close Rasta gives a stable, auditable timeline for the structure of the trend. It teaches users to separate “structure” (close-resolved) from “energy” (intrabar, via RSI).
Visuals:
Fog between the lines (green/red) to show regime.
Rungs between lines to show spread (compression vs expansion).
Optional plotting of EMA8/EMA21 so users can see the gating effect.
Module 2 — RSI (Internal Strength / Energy Layer)
Goal: Reveal the intrabar strength/weakness that often precedes or confirms structural flips.
Method:
Standard RSI with adjustable length and signal smoothing for the panel view.
Logic uses wick-aware sources:
Entry trigger: RSI of LOW (same RSI length) touching or below a lower band (default 15). Think of it as intraband reactivation from the bottom, using the candle’s deepest excursion.
Exit trigger: RSI of HIGH touching or above an upper band (default 85). Think of it as exhaustion at the top, using the candle’s highest excursion.
Realtime + Close Backup: fires intrabar on tick, but if the realtime event was missed, the close backup will note it at bar end.
Cooldown control: optional bars-between-signals to avoid rapid re-triggers on choppy sequences.
Why wick-aware RSI?
A close-only RSI can miss the true micro-extremes that cause reversals. Using LOW/HIGH for triggers captures the behavior that traders actually react to during the bar, while the bar-close backup preserves historical reproducibility.
Module 3 — Pyramid (Continuation / Compounding Layer)
Goal: Teach how continuation behaves once a trend is underway, and how adds can be structured.
Method:
Same dual-line logic as Rasta (EMA vs smoothed EMA), but only fires when already in a position (or after prior entry conditions).
Supports the same EMA 8/21 filter and optional adaptive-on-flip behavior.
Bar close only to maintain historical cohesion.
What it teaches:
Adds tend to cluster when momentum persists.
Students can experiment with add spacing and compare “one-shot entries” vs “laddered adds” during strong regimes.
How the Pieces Work Together
Rasta establishes the structural frame (when the wave flip is real enough to record at close).
RSI validates or challenges that structure by tracking intrabar energy at the extremes (low/high touches).
Pyramid shows what sustained continuation looks like once (1) and (2) align.
This produces a layered view: Structure → Energy → Progression. Users can see when all three line up (strongest phases) and when they diverge (riskier phases or transitions).
How to Use It (Step-by-Step)
Quick Start
Apply script to any symbol/timeframe.
In Strategy/Indicator Properties:
Enable On every tick (recommended).
If available, enable Using bar magnifier and choose a lower resolution (e.g., 1m) to simulate intrabar fills more realistically.
Keep On bar close unchecked if you want to observe realtime logic in live charts (strategies still place orders on close by platform design).
Default behavior: Rasta & Pyramid = bar close; RSI = per tick with close backup.
Reading the Chart
Watch for Rasta Entry/Exit labels: they define clean structural turns on close.
Watch RSI Entry (LOW touch at/below lower band) and RSI Exit (HIGH touch at/above upper band) to gauge internal energy extremes.
Pyramid Add labels reveal continuation phases once a move is already in progress.
Tuning
Rasta smoothing: choose SMA/EMA/RMA/WMA or None. Higher smoothing → later but cleaner flips; lower smoothing → earlier but choppier.
RSI bands: a common educational setting is 15/85 for strong extremes; 20/80 is a bit looser.
Cooldown: increase if you see too many RSI re-fires in chop.
EMA 8/21 filter: toggle ON to study “trend-gated” entries, OFF to study raw momentum flips.
Backtesting Notes (for Strategy Builds)
Stops (optional): trail is armed when price advances by a trigger (default D–F₀), ratchets only upward from HIGH, and hits from LOW (or Close if chosen) with a tiny undershoot buffer to avoid micro-wicks.
Order sequencing per bar (mirrors the script’s code comments):
Trail ratchet via HIGH
Intrabar stop hit via LOW/CLOSE → immediate close
If still in position at bar close: process exits (Rasta/RSI)
If still in position at bar close: process Pyramid Add
If flat at bar close: process entries (Rasta/RSI)
Platform reality: strategies place orders at bar close in historical testing; the intrabar logic improves realism for stops and event marking but final order timestamps are still close-resolved.
Inputs Reference (common)
Modules: enable/disable RSI and Pyramid learning layers.
Rasta: EMA length, smoothing type/length, EMA8/21 filter & adaptive flip, fog opacity, rungs on/off & limit.
RSI: RSI length, signal MA length (panel), Entry band (LOW), Exit band (HIGH), cooldown bars, labels.
Pyramid: EMA length, smoothing, EMA8/21 filter & adaptive adds.
Execution: toggle Bar Close Only for Rasta/Pyramid; toggle Realtime + Close Backup for RSI.
Stops (strategy): Fixed Stop % (first), Fixed Stop % (add), Trail Distance %, Trigger rule (auto D–F₀ or custom), undershoot buffer %, and hit source (LOW/CLOSE).
What to Study With It
Convergence: how often RSI-LOW entry touches precede the next Rasta flip.
Divergence: cases where RSI screams exhaustion (HIGH >= upper band) but Rasta hasn’t flipped yet—often transition zones.
Continuation: how Pyramid adds cluster in strong moves; how spacing changes with smoothing/filter choices.
Regime changes: use EMA8/21 filter toggles to see what happens at macro turns vs chop.
Limitations & Scope
This is a learning tool, not a trade copier. It does not provide financial advice or automated execution.
Intrabar results depend on data granularity; bar magnifier (when available) can help simulate lower-resolution ticks, but true tick-by-tick fills are a platform-level feature and not guaranteed across all symbols.
Suggested Publication Settings (Strategy)
Initial capital: 100
Order size: 100 USD (cash)
Pyramiding: 10
Commission: 0.25%
Slippage: 3 ticks
Recalculate: ✓ On every tick
Fill orders: ✓ Using bar magnifier (choose 1m or similar); leave On bar close unchecked for live viewing.
Educational License
Released under the Michael Culpepper Gratitude License (2025).
Use and modify freely for education and research with attribution. No resale. No promises of profitability. Purpose is understanding, not signals.

NAVJOTDANDIWAL77 GOLD BTC 5 M 1;4
// disclaimer: this script and strategy are created only for educational and informational purposes. it is not financial advice or a recommendation to buy or sell any financial instrument. trading and investing involve significant risk, and past performance does not guarantee future results. do not use this script for live trading or real money decisions. the creator of this script is not responsible for any losses or damages that may occur from its use. use at your own risk.

AR Alerts Basic 🤖A non-repainting, ATR-based trailing stop strategy and session-based trading filters.
Features:
Dynamic buy/sell trailing stops using ATR for stable exits.
EMA exit for remaining positions to lock in profits.
Time session filters: trade only during defined market hours.
Trend detection using EMA50/EMA100 coloring.
Backtest dashboard Table showing total trades, win rate, P&L, growth, profit factor, and max drawdown. can be uncheck from Style Tab.
Fully non-repainting signals for reliable historical testing.
Perfect for traders who want stable signals, trailing stops, and a clean backtest summary in one indicator.
@infonatics
Trade Stock One v3Professional Trading Strategy
Specializes in trading uptrends, riding long-term waves
Limits frequent entries
Suitable for medium- to long-term stock trading


RCI 2 Dashboards ✅ Strategy: RCI 2 Dashboards BY Sonu JAIN
This advanced strategy is built around the Rank Correlation Index (RCI), a unique momentum oscillator, and combines it with a comprehensive suite of powerful indicators to identify high-probability trading opportunities. The strategy’s core strength lies in its ability to filter signals using up to 12 different conditions for both long and short trades.
To make the decision-making process clear and intuitive, the strategy features two dynamic, customizable dashboards right on your chart. The first dashboard gives you a live, detailed breakdown of which conditions are met, while the second provides a real-time overview of the strategy’s performance.
How It Works
The strategy generates entry signals based on RCI crossovers and crossunders. These signals are then filtered by a customizable combination of other indicators to confirm the trade.
Long Entry:
The RCI crosses over its moving average.
All enabled long-side filters are met.
Short Entry:
The RCI crosses under its moving average.
All enabled short-side filters are met.
Key Features
RCI Crossover Logic: The core of the strategy is an RCI crossover/crossunder with a customizable moving average (MA). You can choose from SMA, EMA, SMMA (RMA), WMA, or VWMA.
12 Optional Filters: This strategy goes far beyond a simple RCI signal. You can enable or disable a wide range of filters to refine your entries. These include:
Trend: Supertrend, Parabolic SAR (SAR), and Vortex Indicator.
Volatility: Keltner Channels (KC) and Bollinger Bands (BB).
Momentum: Woodies CCI, Money Flow Index (MFI), and Relative Strength Index (RSI).
Volume: On-Balance Volume (OBV) and simple Volume analysis.
Directional Strength: Average Directional Index (ADX).
Timing: A time-of-day filter to trade only during specific market hours.
Dual Dashboards:
Detailed Condition Dashboard: This dashboard shows you exactly which of the 12 filters are currently met with a simple ✓ or ✗. This provides instant clarity on why a trade is or isn't being considered.
Performance Dashboard: This dashboard displays key performance metrics in real-time, including net profit, win rate, profit factor, max drawdown, and current/max winning and losing streaks. It also provides details on the most recent trade, such as entry, stop-loss, and exit prices.
Customizable Stop Loss: The strategy includes a fixed percentage-based stop loss for both long and short positions, which you can easily configure in the settings.
Trade Direction Control: You can choose to trade "Long Only," "Short Only," or "Long & Short," giving you complete control over your trading bias.
This strategy is a powerful tool for traders who want to build a robust, multi-filtered system. The included dashboards make it an excellent educational tool for understanding how different indicators work together to form a complete trading plan. You can use it to backtest and optimize your own unique combination of indicators to find the perfect setup for your market and timeframe.

Multi-TF MACD/RSI Pro Strategy v6How to Use: Timeframe Setup:
Apply to any chart (1s, 5m, 15m)
Set indicator timeframe in settings
Backtesting: Adjust date range in inputs
Check performance in strategy tester
View results in table (top-right corner)
Live Trading: Green triangles = Buy signals
Red triangles = Sell signals
Red lines = Stop loss levels
Green lines = Take profit targets
Test results after 2000 runs on BTC/USD 5m:
// • Win rate: 53.2%
// • Profit factor: 1.87
// • ROI: 27.4% (6 months)
// • Max drawdown: 11.3%

Multi-Timeframe Wolfe Wave StrategyThis invite-only strategy implements an advanced multi-timeframe Wolfe Wave pattern recognition system specifically designed for institutional-grade algorithmic trading environments.
**Core Mathematical Framework:**
The strategy employs sophisticated mathematical calculations across 10 distinct timeframes (377, 233, 144, 89, 55, 34, 21, 13, 8, 5 periods), utilizing Elliott Wave ratio theory combined with proprietary algorithmic enhancements. Unlike standard Wolfe Wave implementations that rely on visual pattern recognition, this system uses quantitative analysis to identify precise entry and exit points.
**Technical Implementation:**
• **Pattern Detection Algorithm:** Calculates price relationships using configurable ratio sets including Fibonacci sequences, Elliott Wave ratios, Golden Ratio, Harmonic Patterns, Pi-based calculations, and custom mathematical progressions
• **Multi-Timeframe Confluence:** Simultaneously analyzes patterns across all timeframes to ensure signal reliability and reduce false positives
• **Dynamic Target Calculation:** Employs advanced mathematical modeling to project optimal profit targets based on historical price behavior and pattern completion theory
• **Risk Management Engine:** Implements position-based stop losses calculated as percentages of target profits, with liquidation price monitoring for leveraged positions
**Originality and Innovation:**
This implementation differs significantly from traditional Wolfe Wave indicators through several key innovations:
1. **Algorithmic Pattern Validation:** Uses mathematical confirmation across multiple timeframes rather than subjective visual analysis
2. **Adaptive Ratio Selection:** Offers 24 different ratio calculation methods, allowing optimization for various market conditions
3. **Institutional Integration:** Features comprehensive webhook messaging for automated execution via external trading systems
4. **Advanced Position Management:** Includes sophisticated position sizing controls with maximum concurrent position limits
**Strategy Logic:**
For bullish conditions, the algorithm identifies when price action meets specific mathematical criteria:
- Point validation through ratio analysis between swing highs/lows
- Confluence confirmation across multiple timeframes
- Minimum profit threshold filtering to ensure trade quality
- Dynamic stop-loss positioning based on pattern geometry
The mathematical approach uses proprietary calculations that extend beyond traditional Fibonacci levels, incorporating elements from chaos theory, fractal geometry, and advanced statistical analysis.
**Risk Management Features:**
• Configurable stop-loss percentages relative to profit targets
• Maximum position limits to control portfolio exposure
• Liquidation price monitoring for margin trading
• Time-based filtering options for market session control
• Minimum profit threshold settings to filter low-quality signals
**Intended Markets and Conditions:**
Optimized for cryptocurrency markets with high volatility and sufficient liquidity. Works effectively in trending and ranging market conditions due to its multi-timeframe approach. Best suited for assets with clear swing structure and adequate price movement.
**Performance Characteristics:**
The strategy is designed for active trading with frequent position entries across multiple timeframes. Position holding periods vary from short-term scalping to medium-term swing trading depending on pattern completion timeframes.
**Technical Requirements:**
Requires understanding of advanced pattern recognition theory, risk management principles, and algorithmic trading concepts. Users should be familiar with Wolfe Wave methodology and Elliott Wave theory fundamentals.

DCA Alpha 1.0 Trading Tool for Dollar-Cost Averaging
Description:
DCA Alpha 1.0 is a precision-engineered trading tool designed to assist traders and investors in accumulating assets during market downturns. Using proprietary algorithms that combine momentum decay, extreme price deviation metrics, trend dynamics, divergence analysis, and mean regression, it identifies potential bottom extreme zones in various asset classes such as indices, stocks, crypto, and commodities.
This indicator highlights market conditions where assets are oversold, undervalued, or experiencing capitulation—providing disciplined, unleveraged dollar-cost averaging (DCA) opportunities. Ideal for long-term growth strategies, DCA Alpha 1.0 helps cut through market noise, pinpointing moments of peak fear and maximum reward potential.
Whether navigating volatile crypto markets, timing corrections in indices, or accumulating commodities, DCA Alpha 1.0 serves as a vital tool for mastering the art of buying low and building your assets up strategically.
Instructions:
Getting Started:
Add the Indicator:
Install DCA Alpha 1.0 on your TradingView chart.
Select your preferred asset class: stocks, indices, crypto, or commodities.
Choose an appropriate timeframe (e.g., daily or weekly for long-term DCA strategies).
Customize Inputs: Adjust the following settings to align with your strategy:
Percentage of Equity to Trade: Define the portion of your portfolio to allocate per signal (default: 1% equity).
Profit Target Percentages: Set thresholds for locking in gains (default: 50% on lower timeframes, 500% on higher timeframes).
Zones and Signals:
Extreme Negative Zones:
What It Represents:
These zones highlight conditions where prices are deeply oversold, indicating extreme bearish sentiment. The market is likely nearing a bottom, offering high-probability buying opportunities.
Entry Signals:
When the price enters these extreme negative zones, visual markers (e.g., green triangles or other indicators) will signal a potential buying opportunity. These moments are indicative of market exhaustion, signaling that a reversal could be imminent.
Momentum Decay & Divergence:
Momentum decay occurs when price movement slows over time. In extreme negative zones, if prices continue to fall but at a diminishing rate (e.g., decreased volume or a fading oscillator), it suggests weakening bearish momentum. This, coupled with bullish divergence (oscillator forming higher lows while price makes lower lows), signifies a reversal, making it an ideal point to consider dollar-cost averaging into the asset.
Neutral Zones:
What It Represents:
The neutral zone is a state of market equilibrium, where prices are neither overbought nor oversold. The market is in a balanced state, with no strong trend emerging.
Mean Regression:
In a neutral zone, the market is reverting to its mean or average price after overreacting in either direction. A price transition from extreme zones (overbought/oversold) to the neutral zone suggests a reversion to the market's long-term average, making this a period of reduced volatility and uncertainty.
Entering or Exiting Neutral Zones:
Traders should avoid entering or exiting positions during neutral zone conditions unless transitioning from an extreme zone (negative or positive). Transitioning from an extreme negative zone to neutral may suggest an opportunity to accumulate assets gradually, while a shift from neutral to an extreme negative zone may indicate a deeper correction and warrant caution.
Momentum Decay & Divergence (Exiting Neutral Zone):
If prices are rising but the oscillator shows lower highs (bearish divergence), and momentum is fading, this could signal a pullback. A transition out of the neutral zone in this context may prompt traders to hold off on new positions or consider profit-taking.
Extreme Positive Zones:
What It Represents:
Markets can also become overbought or overvalued. When price enters extreme positive zones, the asset may be overvalued, suggesting potential selling or a waiting period.
Exit Signals:
Red triangle indicators signal potential exit points when prices reach overbought conditions, signaling a time to lock in profits and reduce exposure.
Momentum Decay & Divergence (Exiting Positive Zone):
When prices are making new highs but momentum is weakening (momentum decay) and the oscillator is showing lower highs (bearish divergence), this could indicate a faltering rally. Such conditions represent an ideal time to reduce exposure or exit positions.
Key Inputs for Customization:
Percentage of Equity to Trade:
This setting allows you to allocate a portion of your total portfolio per buy signal. By default, 1% of equity is used per signal, but this can be adjusted based on your risk tolerance and strategy.
Profit Target Percentages:
These thresholds help lock in gains once the price moves a set percentage in your favor.
Lower Timeframes: Default profit target of 50%.
Higher Timeframes: Default profit target of 500%.
These settings can be customized for specific risk/reward preferences.
Warning!!! : Aggressive Mode
Aggressive Mode is an advanced feature designed for traders who want to increase the frequency of signals during periods of market volatility. This mode will trigger more frequent entries, even into slightly less extreme zones, capturing short-term reversals.
What Aggressive Mode Does:
It amplifies signals by allowing the tool to identify more frequent price reversals, including brief market corrections, increasing trade frequency. While this can offer more trading opportunities, it also exposes you to higher risk.
Warning:
Aggressive Mode should be used only by experienced traders familiar with short-term volatility. The increased frequency of signals could lead to higher risk exposure. Ensure robust risk management practices, such as stop-loss orders and profit-taking strategies, are in place before activating this mode.
Default Setting:
Aggressive Mode is disabled by default. It can be activated at your discretion based on your experience level and risk appetite.
Best Practices:
Focus on High-Quality Assets: Prioritize assets with strong recovery potential (e.g., major indices, blue-chip cryptocurrencies).
Use Longer Timeframes: Minimize market noise and optimize your DCA strategy by focusing on higher timeframes (e.g., daily or weekly charts).
Review Trading Inputs: Regularly adjust your inputs to ensure they align with your financial goals and risk tolerance.
Implement Risk Management: Use stop-loss orders and profit targets to manage risk, especially when using Aggressive Mode.
Disclaimer:
DCA Alpha 1.0 is designed specifically for unleveraged, long-term dollar-cost averaging strategies. It is not intended for day trading or leveraged positions. The tool excels at identifying market dips but cannot guarantee success. Users are fully responsible for their own risk management, including the use of stop-losses, profit targets, and position sizing.
Aggressive Mode increases trade frequency and may lead to higher exposure and potential losses. Only experienced traders should consider using this mode. Always understand the risks involved before incorporating this tool into your trading strategy.

STRATEGY Fibonacci Levels with High/Low Criteria - AYNET
Here is an explanation of the Fibonacci Levels Strategy with High/Low Criteria script:
Overview
This strategy combines Fibonacci retracement levels with high/low criteria to generate buy and sell signals based on price crossing specific thresholds. It utilizes higher timeframe (HTF) candlesticks and user-defined lookback periods for high/low levels.
Key Features
Higher Timeframe Integration:
The script calculates the open, high, low, and close values of the higher timeframe (HTF) candlestick.
Users can choose to calculate levels based on the current or the last HTF candle.
Fibonacci Levels:
Fibonacci retracement levels are dynamically calculated based on the HTF candlestick's range (high - low).
Users can customize the levels (0.000, 0.236, 0.382, 0.500, 0.618, 0.786, 1.000).
High/Low Lookback Criteria:
The script evaluates the highest high and lowest low over user-defined lookback periods.
These levels are plotted on the chart for visual reference.
Trade Signals:
Long Signal: Triggered when the close price crosses above both:
The lowest price criteria (lookback period).
The Fibonacci level 3 (default: 0.5).
Short Signal: Triggered when the close price crosses below both:
The highest price criteria (lookback period).
The Fibonacci level 3 (default: 0.5).
Visualization:
Plots Fibonacci levels and high/low criteria on the chart for easy interpretation.
Inputs
Higher Timeframe:
Users can select the timeframe (default: Daily) for the HTF candlestick.
Option to calculate based on the current or last HTF candle.
Lookback Periods:
lowestLookback: Number of bars for the lowest low calculation (default: 20).
highestLookback: Number of bars for the highest high calculation (default: 10).
Fibonacci Levels:
Fully customizable Fibonacci levels ranging from 0.000 to 1.000.
Visualization
Fibonacci Levels:
Plots six customizable Fibonacci levels with distinct colors and transparency.
High/Low Criteria:
Plots the highest and lowest levels based on the lookback periods as reference lines.
Trading Logic
Long Condition:
Price must close above:
The lowest price criteria (lowcriteria).
The Fibonacci level 3 (50% retracement).
Short Condition:
Price must close below:
The highest price criteria (highcriteria).
The Fibonacci level 3 (50% retracement).
Use Case
Trend Reversal Strategy:
Combines Fibonacci retracement with recent high/low criteria to identify potential reversal or breakout points.
Custom Timeframe Analysis:
Incorporates higher timeframe data for multi-timeframe trading strategies.
