ARX | Time Window Box AsiaThis script displays a visual time window box on the chart to represent a predefined Asia session time range.
It is a visual and organizational utility only. The script does not analyze price, generate signals, issue alerts, or provide any form of trading guidance.
Its sole purpose is to help users visually identify time periods on a chart.
Educational and organizational use only. Not financial advice.
Utility

SPY/QQQ Customizable Price ConverterThis is a minimalist utility tool designed for Index traders (SPX, NDX, RUT). It allows you to monitor the price of a reference asset (like SPY, QQQ) directly on your main chart without cluttering your screen.
Key Features:
1.🖱️ Crosshair Sync for Historical Data (Highlight): Unlike simple info tables that only show the latest price, this script allows for historical inspection.
· How it works: Simply move your mouse crosshair over ANY historical candle on your chart.
· The script will instantly display the closing price of the reference asset (e.g., SPY) for that specific time in the Status Line (top-left) or the Data Window. Perfect for backtesting and reviewing price action.
2.🔄 Fully Customizable Ticker: Default is set to SPY, but you can change it to anything in the settings.
e.g.
· Trading NDX Change it to QQQ.
· Trading RUT Change it to IWM.
3.📊 Clean Real-Time Dashboard:
· A floating table displays the current real-time price of your reference asset.
· Color-coded text (Green/Red) indicates price movement.
· Fully customizable size, position, and colors to fit your layout.

Average Volume Corner BoxAn indicator that anchors a single info box to the chart’s top right corner. It compares the current volume to a selectable moving average (SMA, EMA, WMA) and displays a status (VOL > AVG or VOL < AVG), the current volume, the average volume, and percent difference. The color switches between red and green backgrounds so you can read volume at a glance without cluttering the chart with those stinky volume rectangles.
Features
• Fixed corner box anchored to the chart top right
• Choose MA type: SMA, EMA, WMA
• Selectable MA length
• Optional percent difference display
• Threshold multiplier to only flag meaningful spikes (e.g., vol > avg * 1.5)
• Configurable colors and font size

Smart Weekly Lines — Clean & Scroll-Proof (Pine v6)Because your chart deserves structure. Elegant weekly dividers that stay aligned, scroll smoothly, and project future weeks using your wished UTC offset.
Smart Weekly Lines draws precise, full-height vertical lines marking each new week — perfectly aligned to your local UTC offset. It stays clean, smooth, and consistent no matter how far you scroll.
Features
• Accurate weekly boundaries based on your local UTC offset (supports half-hour zones like India +5.5)
• Clean, full-height lines that never cut off with zoom or scroll
• Adjustable color, opacity, width, and style (solid, dashed, dotted)
• Future week projection for planning and alignment
• Optional visibility: show only on Daily and Intraday charts
Works with any market — stocks, crypto, forex, or futures.
Built for traders who value clarity, structure, and precision.
Developed collaboratively with the assistance of ChatGPT under my direction and testing.

Weekly Session BreakThis indicator plots a vertical line at the end of the trading week (Friday) to mark the weekly session break. It is designed to be used on intraday charts (sub-1 hour timeframes).
The line's appearance is fully customizable via the Inputs tab, allowing you to change its color, style (solid, dotted, or dashed), and thickness.
Key Features:
End-of-Week Marker: Accurately draws a vertical line on the last bar of the trading week.
Timeframe Specific: Lines are only visible on intraday charts (1-minute to 59-minute timeframes) to prevent clutter on higher timeframes.
Customizable: Adjust the line's color, style, and thickness from the Inputs menu.

Chartlense Dashboard (Data, Trend & Levels)Chartlense Dashboard (Data, Trend & Levels)
Overview
This dashboard is designed to solve two common problems for traders: chart clutter and the manual drawing of support and resistance levels . It consolidates critical data from multiple indicators into a clean table overlay and automatically plots the most relevant S&R levels based on recent price action. The primary goal is to provide a clear, at-a-glance overview of the market's structure and data.
It offers both a vertical and horizontal layout to fit any trader's workspace.
Key Concepts & Calculations Explained
This indicator is more than a simple collection of values; it synthesizes data to provide unique insights. Here’s a conceptual look at how its core components work:
Automatic Support & Resistance (Pivot-Based):
The dashed support (green) and resistance (red) lines are not manually drawn. They are dynamically calculated based on the most recent confirmed pivot highs and pivot lows . A pivot is a foundational concept in technical analysis that identifies potential turning points in price action.
How it works: A pivot high is a candle whose `high` is higher than a specific number of candles to its left and right (the "Pivot Lookback" is set to 5 by default in the settings). A pivot low is the inverse. By automatically identifying these confirmed structural points, the script visualizes the most relevant levels of potential supply and demand on the chart.
Relative Volume (RVOL):
This value in the table is not the standard volume. It measures the current bar's volume against its recent average (specifically, `current volume / 10-period simple moving average of volume`).
Interpretation: A reading above 2.0 (indicated by green text) suggests that the current volume is more than double the recent average. This technique is used to identify significant volume spikes, which can add conviction to breakouts or signal potential market climaxes.
Consolidated Data for Context:
Other values displayed in the table, such as the EMAs (9, 20, 200) , Bollinger Bands (20, 2) , RSI (14) , MACD (12, 26, 9) , and VWAP (on intraday charts), use their standard industry calculations. They are included to provide a complete contextual picture without needing to load each indicator separately, saving valuable chart space.
How to Use This in Your Trading
This dashboard is designed as a tool for confluence and context , not as a standalone signal generator. Here are some ways to integrate it into your analysis workflow:
As a Trend Filter: Before considering a trade, quickly glance at the EMAs and the MACD values in the table. A price above the key EMAs and a positive MACD can serve as a quick confirmation that you are aligned with the dominant trend.
To Validate Breakouts: When the price is approaching a key Resistance level (red pivot line), watch the RVOL value . A reading above 2.0 on the breakout candle adds significant confirmation that the move is backed by strong interest. The same logic applies to breakdowns below a support level.
To Spot Potential Reversals: Confluence is key. For example, if the price is testing a Support level (green pivot line) AND the RSI in the table is approaching oversold levels (e.g., near 30), it can signal a higher probability reversal setup.
About This Indicator
This indicator was developed by the team at ChartLense to help traders declutter their charts and focus on the data that matters. We believe in making complex analysis more accessible and organized. We hope this free tool is a valuable addition to your trading process.

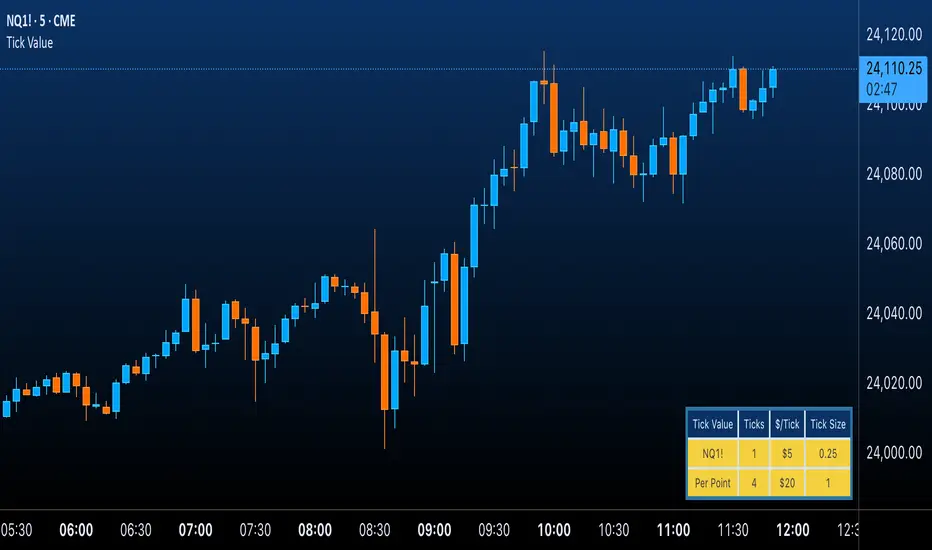
Futures Tick & Point Value [BoredYeti]Futures Tick & Point Value
This utility displays tick size, dollars per tick, and (optionally) a per-point row for the current futures contract.
Features
• Hardcoded $/tick map for common CME/NYMEX/CBOT/COMEX contracts
• Automatic fallback using pointvalue * mintick for any other symbol
• Table settings: adjustable position, text size, customizable colors
• Optional “Per Point” row showing ticks and $/point
Notes
• Contract specs can vary by broker/exchange and may change over time. Always confirm with official specifications.
• Educational tool only; not financial advice.
ACR(Average Candle Range) With TargetsWhat is ACR?
The Average Candle Range (ACR) is a custom volatility metric that calculates the mean distance between the high and low of a set number of past candles. ACR focuses only on the actual candle range (high - low) of specific past candles on a chosen timeframe.
This script calculates and visualizes the Average Candle Range (ACR) over a user-defined number of candles on a custom timeframe. It displays a table of recent range values, plots dynamic bullish and bearish target levels, and marks the start of each new candle with a vertical line. All calculations update in real time as price action develops. This script was inspired by the “ICT ADR Levels - Judas x Daily Range Meter°” by toodegrees.
Key Features
Custom Timeframe Selection: Choose any timeframe (e.g., 1D, 4H, 15m) for analysis.
User-Defined Lookback: Calculate the average range across 1 to 10 previous candles.
Dynamic Targets:
Bullish Target: Current candle low + ACR.
Bearish Target: Current candle high – ACR.
Live Updates: Targets adjust intrabar as highs or lows change during the current candle.
Candle Start Markers: Vertical lines denote the open of each new candle on the selected timeframe.
Floating Range Table:
Displays the current ACR value.
Lists individual ranges for the previous five candles.
Extend Target Lines: Choose to extend bullish and bearish target levels fully across the screen.
Global Visibility Controls: Toggle on/off all visual elements (targets, vertical lines, and table) for a cleaner view.
How It Works
At each new candle on the user-selected timeframe, the script:
Draws a vertical line at the candle’s open.
Recalculates the ACR based on the inputted previous number of candles.
Plots target levels using the current candle's developing high and low values.
Limitation
Once the price has already moved a full ACR in the opposite direction from your intended trade, the associated target loses its practical value. For example, if you intended to trade long but the bearish ACR target is hit first, the bullish target is no longer a reliable reference for that session.
Use Case
This tool is designed for traders who:
Want to visualize the average movement range of candles over time.
Use higher or lower timeframe candles as structural anchors.
Require real-time range-based price levels for intraday or swing decision-making.
This script does not generate entry or exit signals. Instead, it supports range awareness and target projection based on historical candle behavior.
Key Difference from Similar Tools
While this script was inspired by “ICT ADR Levels - Judas x Daily Range Meter°” by toodegrees, it introduces a major enhancement: the ability to customize the timeframe used for calculating the range. Most ADR or candle-range tools are locked to a single timeframe (e.g., daily), but this version gives traders full control over the analysis window. This makes it adaptable to a wide range of strategies, including intraday and swing trading, across any market or asset.

Share SizeA helpful tool that estimates the amount of times you can trade at your current share size in a small account.
You can adjust the numbers in the settings page!

Swing DistanceHello fellas,
This simple indicator helps to visualize the distance between swings. It consists of two lines, the highest and the lowest line, which show the highest and lowest value of the set lookback, respectively. Additionally, it plots labels with the distance (in %) between the highest and the lowest line when there is a change in either the highest or the lowest value.
Use Case:
This tool helps you get a feel for which trades you might want to take and which timeframe you might want to use.
Side Note: This indicator is not intended to be used as a signal emitter or filter!
Best regards,
simwai

Multi-Chart Widget [LuxAlgo]The Multi-Chart Widget tool is a comprehensive solution crafted for traders and investors looking to analyze multiple financial instruments simultaneously. With the capability to showcase up to three additional charts, users can customize each chart by selecting different financial instruments, and timeframes.
Users can add various widely used technical indicators to the charts such as the relative strength index, Supertrend, moving averages, Bollinger Bands...etc.
🔶 USAGE
The tool offers traders and investors a comprehensive view of multiple charts simultaneously. By displaying up to three additional charts alongside the primary chart, users can analyze assets across different timeframes, compare their performance, and make informed decisions.
Users have the flexibility to choose from various customizable chart types, including the recently added "Volume Candles" option.
This tool allows adding to the chart some of the most widely used technical indicators, such as the Supertrend, Bollinger Bands, and various moving averages.
In addition to the charting capabilities, the tool also features a dynamic statistic panel that provides essential metrics and key insights into the selected assets. Users can track performance indicators such as relative strength, trend, and volatility, enabling them to identify trends, patterns, and trading opportunities efficiently.
🔶 DETAILS
A brief overview of the indicators featured in the statistic panel is given in the sub-section below:
🔹Dual Supertrend
The Dual Supertrend is a modified version of the Supertrend indicator, which is based on the concept of trend following. It generates buy or sell signals by analyzing the asset's price movement. The Dual Supertrend incorporates two Supertrend indicators with different parameters to provide potentially more accurate signals. It helps traders identify trend reversals and establish trend direction in a more responsive manner compared to a single Supertrend.
🔹Relative Strength Index
The Relative Strength Index is a momentum oscillator that measures the speed and change of price movements. RSI oscillates between 0 and 100 and is typically used to identify overbought or oversold conditions in a market. Traditionally, RSI values above 70 are considered overbought, suggesting that the asset may be due for a reversal or correction, while RSI values below 30 are considered oversold, indicating potential buying opportunities.
🔹Volatility
Volatility in trading refers to the degree of variation or fluctuation in the price of a financial instrument, such as a stock, currency pair, or commodity, over a certain period of time. It is a measure of the speed and magnitude of price changes and reflects the level of uncertainty or risk in the market. High volatility implies that prices are experiencing rapid and significant movements, while low volatility suggests that prices are relatively stable and are not changing much. Traders often use volatility as an indicator to assess the potential risk and return of an investment and to make informed decisions about when to enter or exit trades.
🔹R-Squared (R²)
R-squared, also known as the coefficient of determination, is a statistical measure that indicates the proportion of the variance in the dependent variable that is predictable from the independent variable(s). In other words, it quantifies the goodness of fit of a regression model to the observed data. R-squared values range from %0 to %100, with higher values indicating a better fit of the model to the data. An R-squared of 100% means that all movements of a security are completely explained by movements in the index, while an R-squared value of %0 indicates that the model does not explain any of the variability in the dependent variable.
In simpler terms, in investing, a high R-squared, from 85% to 100%, indicates that the stock’s or fund’s performance moves relatively in line with the index. Conversely, a low R-squared (around 70% or less) indicates that the fund's performance tends to deviate significantly from the movements of the index.
🔶 SETTINGS
🔹Mini Chart(s) Generic Settings
Mini Charts Separator: This option toggles the visibility of the separator lines.
Number Of Bars: Specifies the number of bars to be displayed for each mini chart.
Horizontal Offset: Determines the distance at which the mini charts will be displayed from the primary chart.
🔹Mini Chart Settings: Top - Middle - Bottom
Mini Chart Top/Middle/Bottom: Toggle the visibility of the selected mini chart.
Symbol: Choose the financial instrument to be displayed in the mini chart. If left as an empty string, it will default to the current chart instrument.
Timeframe: This option determines the timeframe used for calculating the mini charts. If a timeframe lower than the chart's timeframe is selected, the calculations will be based on the chart's timeframe.
Chart Type: Selection from various chart types for the mini charts, including candles, volume candles, line, area, columns, high-low, and Heikin Ashi.
Chart Size: Determines the size of the mini chart.
Technical Indicator: Selection from various technical indicators to be displayed on top of the mini charts.
Note : Chart sizing is relative to other mini charts. For example, If all the mini charts are sized to x5 relative to each other, the result will be the same as if they were all sized as x1. This is because the relative proportions between the mini charts remain consistent regardless of their absolute sizes. Therefore, their positions and sizes relative to each other remain unchanged, resulting in the same visual representation despite the differences in absolute scale.
🔹Supertrend Settings
ATR Length: is the lookback length for the ATR calculation.
Factor: is what the ATR is multiplied by to offset the bands from price.
Color: color customization option.
🔹Moving Average Settings
Type: is the type of the moving average, available types of moving averages include SMA (Simple Moving Average), EMA (Exponential Moving Average), RMA (Root Mean Square Moving Average), HMA (Hull Moving Average), WMA (Weighted Moving Average), and VWMA (Volume Weighted Moving Average).
Source: Determines what data from each bar will be used in calculations.
Length: The time period to be used in calculating the Moving Average.
Color: Color customization option.
🔹Bollinger Bands Settings
Basis Type: Determines the type of Moving Average that is applied to the basis plot line.
Source: Determines what data from each bar will be used in calculations.
Length: The time period to be used in calculating the Moving Average which creates the base for the Upper and Lower Bands.
StdDev: The number of Standard Deviations away from the Moving Average that the Upper and Lower Bands should be.
Color: Color customization options for basis, upper and lower bands.
🔹Mini Chart(s) Panel Settings
Mini Chart(s) Panel: Controls the visibility of the panel containing the mini charts.
Dual Supertrend: Toggles the display of the evaluated dual super trend, based on the super trend settings provided below the option. The definitions for the options are the same as stated above for the super trend.
Relative Strength Index: Toggles the display of the evaluated RSI, based on the source and length settings provided below the option.
Volatility: Toggles the display of the calculated Volatility, based on the length settings provided below the option.
R-Squared: Toggles the display of the calculated R-Squared (R²), based on the length settings provided below the option.
🔶 LIMITATIONS
The tool allows users to display mini charts featuring various types of instruments alongside the primary chart instrument. However, there's a limitation: the selected primary chart instrument must have an ACTIVE market status. Alternatively, if the primary chart instrument is not active, the mini chart instruments must belong to the same exchange and have the same type as the primary chart instrument.

[TTI] Closing Range Indicator📜 ––––HISTORY & CREDITS––––
This Pine Script Utility indicator, titled " Closing Range Indicator," is designed and developed by TintinTrading but inspired by the teaching of Investor's Business Daily (IBD) and William O'Neil. It aims to help traders identify the closing range of a given timeframe, either daily or weekly.
🦄 –––UNIQUENESS–––
The unique feature of this indicator lies in its ability to simulate a functionality of Closing Range calculation based on hovering of the mouse over the close. It employs a conditional display that allows the user to set the indicator as 'invisible' without removing it from the chart and hence provides a numerical closing range value when hovering over the indicator.
🛠️ ––––WHAT IT DOES––––
The Closing Range Indicator calculates the closing range of a trading bar in terms of percentages. It computes the difference between the closing price and the low price of the bar, and then divides it by the range of the bar.
A stock that closes on the high would display 100%
A stock that closes on the low would display 0%
Generally, the higher the percentage the more bullish the close but there are exceptions to this rule.
The indicator can operate on two timeframes:
Daily : Computes the closing range based on the daily high, low, and closing prices.
Weekly : Computes the closing range based on the weekly high, low, and closing prices. If you enable the weekly it will show the weekly close on all daily timeframes. Meaning that if the week Closing range is 54.15% on Friday, it will show the value 54.15% for all days prior to Friday from the same week.
The indicator places a label at the close of each bar, with the label's tooltip showing the calculated closing range percentage. I generally hide the label and just reference the tooltip calculation with a a hoover on top of the bar.
💡 ––––HOW TO USE IT––––
Installation: Add the indicator to your TradingView chart by searching for " Closing Range Indicator" in the indicator library.
Reorder: Reorder the indicator so that it sits as the first indicator (even above the price) on the Pane. This will make sure that you always trigger the tooltip functionality.
Go to Settings:
Timeframe: Choose between daily ('D') and weekly ('W') timeframes from the settings.
Visibility: Enable the 'Make Invisible' option if you want the indicator to be hidden.
Interpretation:
A higher percentage indicates that the closing price is closer to the high of the range, signaling bullish sentiment.
A lower percentage indicates bearish sentiment.
Tooltip: Hover over the label to view the closing range in percentage terms.

Hide Active Candle [SteinG]Hide Active Candle
An essential tool for disciplined traders seeking to avoid making hasty decisions based on active bars that have not yet closed.
Have you ever found yourself eagerly anticipating an entry, only to be tempted by an active candle that starts to pull away? Or perhaps you've been caught in a trade where an active candle pushes against you, stirring unease and uncertainty. Fear not, for we have a solution!
"Hide Active Candle" is a simple Pine Script indicator designed to ghost the active bar on your chart, reinforcing the importance of patiently waiting for its closure before making any trading decisions. By masking the active candle, this indicator serves as a constant reminder to exercise caution and to base your actions on solid, confirmed information.
To make the most of this powerful tool, ensure that you are using a candlestick chart, as this script operates optimally within that framework. Follow these simple steps to get started:
1. Right-click on your chart and select "Settings..."
2. From the drop-down menu, choose "Symbol" under the "Chart Settings" section.
3. Disable every item in the list to fully utilize the capabilities of "Hide Active Candle."
But wait, there's more! We understand that each trader has unique preferences and requirements. That's why we've included customizable settings within the script to tailor it to your specific needs. You have the option to adjust the following parameters:
- Countdown seconds left : Specify the number of seconds before the bar closes when the current candle becomes visible.
- Bull candle color : Select the color that represents bullish candles on your chart.
- Bear candle color : Choose the color that indicates bearish candles.
- Equal candle color : Define the color for Doji star candles.
- Theme : Opt for a dark or light theme, as the active candle mask will be based on your chosen theme.
- Custom hidden color : Personalize the mask color according to your preferences.
By fine-tuning these settings, you can create a trading environment that perfectly suits your style and enhances your decision-making process.

NNFX Exposure UtilityOVERVIEW
This tool allows the user to manually keep track of how much of their account is currently exposed to each currency, and keep that information handy and organized on the chart as a table.
It is specialized for NNFX traders who are trading all the pairs among the 9 major currency crosses: AUD, CAD, CHF, EUR, GBP, JPY, NZD, SGD, USD.
HOW DO I USE THIS INDICATOR?
Before you take a trade, you should open the indicator settings for this indicator and check off which currencies you are about to go long and short on. Here are 3 trades taken as examples:
If you go long on EUR/USD with 2% risk, your exposure is 2% long on EUR and 2% short on USD.
Then if you go short on GBP/SGD with 2% risk, your exposure is 2% short on GBP and 2% long on SGD.
But if you go long on SGD/JPY with 2% risk, your exposure would now be 4% long on SGD and 2% short on JPY. This is against your rules if you are trading the NNFX way. So this tool allows you to see when you are about to accidentally overexpose yourself to any currency pair.

pineCalc- Calculator for PineHello and welcome to v1.00 of pineCalc - the calculator for Pine
A sleek, quick, and discrete calculator in a window pane in your chart!
Right now it supports basic math operation and series of two numbers but will try to update it and don't hesitate to comment any ideas
SOME FEATURES:
- Supports decimal numbers.
- Switch statement with option to choose Addition, Subtraction, Multiplication , or Division
- Choose any two numbers to use math on
- Inputs, Math Type and Result Output

No Active BarThis is probably the only script on TradingView that's clinically proven to lower your blood pressure!***
This script in conjunction with some chart settings changes can completely hide the active candle, only showing historic candles, thus, reducing risk of cardiac arrest and or panic attack.
What to do:
0. Make sure you are using a candlestick chart or this script won't work properly
1. Right click the chart and select "Settings..."
2. Select "Symbol" under the "Chart Settings" menu
3. Disable every item EXCEPT for the "Body"
4. Click on the boxes next to "Body" to access the color picker then change both box's transparency settings down to 0
(the script only colors closed bars, so the active bar will be present just transparent)
5. Right click on the price scale on the far left or far right side of the screen and hover the mouse over "Labels". If any selections have a check mark next to them click them to disable them (especially the "Ask & Bid" price setting since it tracks current price)
That's it! Instead of wicks the High & Low prices are plotted above and below the candles using a step line. It looks a bit strange at first but you'll get used to it. Check out the indicator settings to change the color and style of the High & Low lines.
***The statement could prove true for some but is mostly complete bullshit

Syminfo [Epi]Hello! This little script tells you everything TradingView lets you access in a ticker's syminfo in Pine Script:
- description
- type: crypto, economic, forex, fund, futures, index, spread, stock
- tickerid, such as AMEX:BLOK
- prefix, such as AMEX
- Ticker, such as BLOK
- root: for derivatives such as futures contracts
- currency, such as USD
- base currency: returns 'BTC' for the ticker 'BTCUSD'
- mintick
- point value
- session: regular, extended
- timezone
Some surprises I found in my development:
- there are some more types than mentioned in the documentation,
- the tickerid takes on additional information if you adjust for dividends or show extended session,
- the prefix contains "_DL" additions depending on your data subscriptions, .e.g. "CME_MINI_DL:ES1!",
- with futures, TV will show session.regular both for the 'regular' and the 'electronic' session.
- Unfortunately, syminfo does not contain the 'sector', although TV has the information in the database (the sector is shown in the screener but not accessed in Pine Script).
I use this little utility in my development and hope it's useful for the community. I see such a great number of contributions from the community and would like to give back, even if it's not much.

[TEMPLATE] Code Block Comments█ OVERVIEW
Here I present to the community at large a collection of code comment blocks that I think will be useful, especially for larger script projects bordering on 2,000 lines or above of code.
█ PLANNED FUTURE UPDATES
Work with the community to expand this template to be even more useful with the inclusion of useful global colour sets, variables, tooltips, groups, etc.
better script thumbnail.
full-screen table or label outlining the script's use-cases.

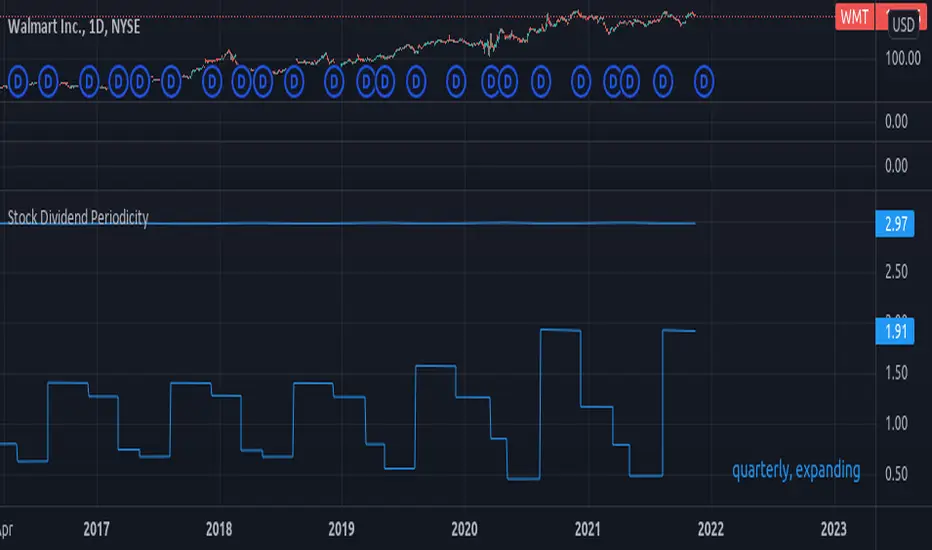
Stock Dividend Periodicityexperimental:
a basic method to evaluate stock dividend periodicity.
known issues:
* it does not adapt well to changes in periodicity, if there is a big enough change on the dividend period plan.
Run TimerThis is a simple utility which counts the number of bars and time elapsed after starting the script. This can be used in time or bars based conditions to modify script behavior.
This particular script does the following:
Starts timer when script is added to chart
Timer is green when starting and continues to be in green if the right Auth key is used in input (Which is hardcoded as 1234 here)
If right auth key is not provided in the input, timer background turns red after trial bars.
Script can be modified to use elapsed time instead.
Thanks to @Bjorgum on assisting on few calculations :)


