CandelaCharts - Unicorn Model📝 Overview
The Unicorn Model is an advanced indicator that pinpoints high-probability reversal setups based on the ICT Unicorn formation. It uses a zigzag-based structure to detect engineered liquidity grabs followed by sharp displacements in the opposite direction—ideal for fade entries or the start of new trends.
The indicator is enhanced with macro time filters, allowing it to align model detections with key trading sessions and institutional flow windows.
The ICT Unicorn Model is a precision-driven intraday strategy rooted in smart money concepts. It combines time-of-day sensitivity, engineered liquidity runs, and institutional order flow to uncover high-quality trading opportunities.
📦 Features
Liquidity Levels: Projects forward-looking liquidity zones after a Unicorn model is confirmed, highlighting potential price targets. These zones act as magnet areas where price is likely to be drawn, helping traders manage exits, partials, and re-entries with greater precision.
Unicorn: The Unicorn formation utilizes a smart money framework and a dynamic zigzag detection method to identify engineered liquidity grabs—sharp sweeps of previous highs or lows—followed by impulsive reversals.
Macros: These time-based intervals represent key moments when institutional algorithms are most active, seeking liquidity, rebalancing, or delivering price to key levels like fair value gaps and liquidity pools.
Custom TF Pairing: Choose your preferred combination of entry timeframe and context timeframe. For example, trade 5m setups within a 1h HTF bias, allowing precise alignment of microstructure with broader directional intent.
HTF & LTF PD Arrays: Displays high- and low-timeframe PD Arrays (e.g., Fair Value Gaps, Inversion Fair Value Gaps) that act as zones of interest or rejection, enhancing confluence and risk control.
History: Backtest previous Unicorn setups directly on the chart. Toggle historical models to analyze past behavior, improve your confidence, and fine-tune your trade execution across varying market regimes.
Killzone Filter: Restrict signal generation to specific trading sessions or killzones (e.g., London Open, New York AM). This minimizes false positives in low-volume or overlapping ranges.
Standard Deviation: Dynamically calculates and plots four deviation bands from the model confirmation point. These levels offer insight into stretch targets, volatility bands, and potential mean-reversion zones.
Dashboard: A real-time control panel showing the active model, HTF candle timer, current directional bias, asset name, and session date—offering clarity and fast decision-making at a glance.
⚙️ Settings
Core
Status: Filter models based on status
Bias: Controls what model type will be displayed, bullish or bearish
Fractal: Controls the timeframe pairing that will be used
Length: Sets the maximum number of candles allowed for a model to develop
Labels: Display the model label (e.g., C1, C2, Cn)
Unicorn
Zigzag: Adjusts the length of the Zigzag formation
Breaker: Defines the style of Breaker Blocks
Sweeps
Sweep: Shows the sweep that forms a model
I-sweep: Controls the visibility of invalidated sweeps
D-purge: Plots the double purge sweeps
S-area: Highlights the sweep area
Liquidity
Liquidity: Displays the liquidity levels that belong to the model
History
History: Controls the number of past models displayed on the chart
Filters
Asia: Filter models based on Asia Killzone hours
London: Filter models based on London Killzone hours
NY AM: Filter models based on NY AM Killzone hours
NY Launch: Filter models based on NY Launch Killzone hours
NY PM: Filter models based on NY PM Killzone hours
Custom: Filter models based on user Custom hours
HTF
Candles: Controls the number of HTF candles that will be visible on the chart
NY Open: Display True Day Open line
Offset: Controls the distance of HTF from the current chart
Space: Controls the space between HTF candles
Size: Controls the size of HTF candles
PD Array: Displays ICT PD Arrays
CE Line: Style the equilibrium line of PD Array
Border: Style the border of the PD Array
LTF
H/L Line: Displays on the LTF chart the High and Low of each HTF candle
O/C Line: Displays on the LTF chart the Open and Close of each HTF candle
PD Array: Displays ICT PD Arrays
CE Line: Style the equilibrium line of PD Array
Border: Style the border of the PD Array
Standard Deviation
StDev: Controls standard deviation of available levels
Labels: Controls the size of standard deviation levels
Anchor: Controls the anchor point of standard deviation levels (wick, body)
Lines: Controls the line widths and color of standard deviation levels
Dashboard
Panel: Display information about the current model
💡 Framework
The Unicorn Model analyzes price action by combining key elements to identify high-probability trade setups. It detects liquidity sweeps and uses a zigzag method to spot Breaker Blocks. The model maps PD Arrays like Fair Value Gaps and Inversion FVGs for precision zones, integrates macro time filters for context, and projects forward price targets based on liquidity clusters. Together, these components provide a clear framework to anticipate market trends and optimize entries and exits.
The model incorporates the following timeframe pairing:
15s - 5m
1m - 15m
1m - 30m
2m - 20m
3m - 30m
3m - 60m
5m - 1H
15m - 4H
15m - 8H
30m - 9H
30m - 12H
1H - 1D
2H - 2D
3H - 3D
4H - 1W
8H - 2W
12H - 3W
1D - 1M
2D - 2M
1W - 3M
2W - 6M
3W - 9M
1M - 12M
Below are the key components that make up the model:
Sweep
D-purge
Zigzag (Breaker)
PD Arrays (FVG, IFVG)
Macros
Standard Deviation
Liquidity
The Unicorn Model operates through a defined lifecycle that tracks its current stage, helping to assess the validity of potential trade opportunities.
The model's lifecycle includes the following statuses:
Formation (grey)
Invalidation (red)
Success (green)
Through the phases of Formation, Invalidation, and Success, traders can effectively manage positions, minimize risk, and capitalize on the high-probability setups presented by the Unicorn Model.
⚡️ Showcase
The Unicorn Model is an advanced trading framework designed to elevate your market analysis and increase your trading edge. By leveraging smart money concepts and sophisticated pattern detection, it helps you spot key liquidity sweeps, reversal zones, and high-probability setups, enabling more precise entries, exits, and risk management tailored to market structure.
LTF PD Array
LTF PD Arrays are crucial to the Unicorn Model and must align with the Zigzag Breaker for the setup to be considered valid.
HTF PD Array
Higher-Timeframe PD Arrays deliver essential macro context, serving to validate both the direction and momentum of potential reversals.
Timeframe Alignment
Timeframe alignment is a fundamental element of the Unicorn trading model. By integrating multi-timeframe context, the model effectively identifies high-probability models.
Killzone Filters
Filter Unicorn Models according to key market sessions—Asia, London, New York AM, New York Launch, and New York PM—to target periods of high liquidity. This approach improves the accuracy and timing of trade setups by capturing moments when smart money is most active.
Macros
The Unicorn Model uses ICT Macro Times to identify key trading periods when institutional activity is most intense. By syncing setups with these critical windows, the model improves accuracy and provides better context for entries, risk management, and potential reversals.
Gain a trading advantage with the Unicorn Model — your essential tool for clearer insights, smarter decision-making, and more confident trade execution.
🚨 Alerts
This script provides alert options for all model types, which must be configured within TradingView.
Bearish Model
A bearish model alert is triggered when a model forms, signaling a 4 Zigzag points formation and a bearish Breaker.
Bullish Model
A bullish model alert is triggered when a model forms, signaling a 4 Zigzag points formation and a bullish Breaker.
⚠️ Disclaimer
These tools are exclusively available on the TradingView platform.
Our charting tools are intended solely for informational and educational purposes and should not be regarded as financial, investment, or trading advice. They are not designed to predict market movements or offer specific recommendations. Users should be aware that past performance is not indicative of future results and should not rely on these tools for financial decisions. By using these charting tools, the purchaser agrees that the seller and creator hold no responsibility for any decisions made based on information provided by the tools. The purchaser assumes full responsibility and liability for any actions taken and their consequences, including potential financial losses or investment outcomes that may result from the use of these products.
By purchasing, the customer acknowledges and accepts that neither the seller nor the creator is liable for any undesired outcomes stemming from the development, sale, or use of these products. Additionally, the purchaser agrees to indemnify the seller from any liability. If invited through the Friends and Family Program, the purchaser understands that any provided discount code applies only to the initial purchase of Candela's subscription. The purchaser is responsible for canceling or requesting cancellation of their subscription if they choose not to continue at the full retail price. In the event the purchaser no longer wishes to use the products, they must unsubscribe from the membership service, if applicable.
We do not offer reimbursements, refunds, or chargebacks. Once these Terms are accepted at the time of purchase, no reimbursements, refunds, or chargebacks will be issued under any circumstances.
By continuing to use these charting tools, the user confirms their understanding and acceptance of these Terms as outlined in this disclaimer.
Unicorn

Unicorn ICT Signals [TradingFinder] Breaker Block + FVG Zones🔵 Introduction
The "ICT Unicorn Model" trading strategy in the "Inner Circle Trader" (ICT) style is one of the well-known strategies in the world of Forex and financial market trading.
The ICT methodology was developed by Michael Huddleston and is based on technical analysis and Price Action concepts.
This style focuses specifically on interpreting price movements and identifying optimal entry and exit points in the market.
In the Unicorn strategy, traders seek points where the probability of price reversal or trend continuation is high. This strategy is primarily based on recognizing and analyzing Price Action patterns and market structure.
By understanding"ICT Unicorn Model", traders can make more informed decisions about where to enter or exit trades, thereby increasing their chances of success in the market.
🟣 Understanding the Breaker Block
A Breaker Block is a specialized form of an Order Block that changes its role after a key market level is broken. Typically, an Order Block is an area on the chart where large institutional orders are likely to be placed, providing strong support or resistance.
However, when this area is breached, and the price moves in the opposite direction, it transforms into what is known as a Breaker Block. This shift indicates a reversal in market sentiment, turning the previous support into resistance or vice versa, thereby signaling a potential trend change to traders.
🟣 The Significance of the Fair Value Gap (FVG)
The Fair Value Gap (FVG) refers to an area on a price chart where the price rapidly moves through a level, leaving behind a gap. This gap represents an imbalance between supply and demand and is often seen as a potential area for price to return and fill the gap.
These zones are crucial for traders as they can indicate future price movements, providing opportunities to enter or exit trades.
🟣 Defining the ICT Unicorn Model
When an FVG overlaps with a Breaker Block, it forms a highly significant trading area known as a Unicorn. This overlap creates an ideal zone for traders to enter the market, as it combines two powerful technical signals.
The Unicorn Model is therefore considered an optimal strategy for identifying precise entry and exit points in the financial markets.
Demand ICT Unicorn Model :
Supply ICT Unicorn Model :
🔵 How to Use
🟣 Bullish ICT Unicorn
The Bullish ICT Unicorn model is applicable when the market is in an uptrend, and traders are seeking buying opportunities.
Follow these steps to identify Bullish ICT Unicorn :
Identify the Bullish Breaker Block : Locate an area where the price moved upward after breaking an Order Block. This area now acts as a Breaker Block.
Identify the Bullish FVG : Look for a Fair Value Gap near the Breaker Block.
Confirm the Unicorn : When the Bullish Breaker Block and Bullish FVG overlap, a Bullish Unicorn is confirmed. Traders can enter a buy position when the price returns to this zone.
🟣Bearish ICT Unicorn
The Bearish ICT Unicorn model is used when the market is in a downtrend, and traders are looking for selling opportunities.
To identify Bearish ICT Unicorn, follow these steps :
Identify the Bearish Breaker Block : Find an area where the price moved downward after breaking an Order Block. This area now acts as a Breaker Block.
Identify the Bearish FVG : Check if a Fair Value Gap has formed near the Breaker Block.
Confirm the Unicorn : When the Bearish Breaker Block and Bearish FVG overlap, a Bearish Unicorn is confirmed. Traders can enter a sell position when the price returns to this zone.
🔵 Setting
🟣 Global Setting
Pivot Period of Order Blocks Detector : Enter the desired pivot period to identify the Order Block.
Order Block Validity Period (Bar) : You can specify the maximum time the Order Block remains valid based on the number of candles from the origin.
Mitigation Level Breaker Block : Determining the basic level of a Breaker Block. When the price hits the basic level, the Breaker Block due to mitigation.
Mitigation Level FVG : Determining the basic level of a FVG. When the price hits the basic level, the FVG due to mitigation.
Mitigation Level Unicorn : Determining the basic level of a Unicorn Block. When the price hits the basic level, the Unicorn Block due to mitigation.
🟣 Unicorn Block Display
Show All Unicorn Block : If it is turned off, only the last Order Block will be displayed.
Demand Unicorn Block : Show or not show and specify color.
Supply Unicorn Block : Show or not show and specify color.
🟣 Breaker Block Display
Show All Breaker Block : If it is turned off, only the last Breaker Block will be displayed.
Demand Main Breaker Block : Show or not show and specify color.
Demand Sub (Propulsion & BoS Origin) Breaker Block : Show or not show and specify color.
Supply Main Breaker Block : Show or not show and specify color.
Supply Sub (Propulsion & BoS Origin) Breaker Block : Show or not show and specify color.
🟣 Fair Value Gap Display
Show Bullish FVG : Toggles the display of demand-related boxes.
Show Bearish FVG : Toggles the display of supply-related boxes.
🟣 Logic Settings
🟣 Order Block Refinement
Refine Order Blocks : Enable or disable the refinement feature. Mode selection.
🟣 FVG Filter
FVG Filter : This refines the number of identified FVG areas based on a specified algorithm to focus on higher quality signals and reduce noise.
Types of FVG filters :
Very Aggressive Filter: Adds a condition where, for an upward FVG, the last candle's highest price must exceed the middle candle's highest price, and for a downward FVG, the last candle's lowest price must be lower than the middle candle's lowest price. This minimally filters out FVGs.
Aggressive Filter: Builds on the Very Aggressive mode by ensuring the middle candle is not too small, filtering out more FVGs.
Defensive Filter: Adds criteria regarding the size and structure of the middle candle, requiring it to have a substantial body and specific polarity conditions, filtering out a significant number of FVGs.
Very Defensive Filter: Further refines filtering by ensuring the first and third candles are not small-bodied doji candles, retaining only the highest quality signals.
🟣 Alert
Alert Name : The name of the alert you receive.
Alert ICT Unicorn Model Block Mitigation :
On / Off
Message Frequency :
This string parameter defines the announcement frequency. Choices include: "All" (activates the alert every time the function is called), "Once Per Bar" (activates the alert only on the first call within the bar), and "Once Per Bar Close" (the alert is activated only by a call at the last script execution of the real-time bar upon closing). The default setting is "Once per Bar".
Show Alert Time by Time Zone :
The date, hour, and minute you receive in alert messages can be based on any time zone you choose. For example, if you want New York time, you should enter "UTC-4". This input is set to the time zone "UTC" by default.
🔵Conclusion
The Unicorn Model in ICT, utilizing the concepts of Breaker Blocks and Fair Value Gaps, provides an effective tool for identifying entry and exit points in financial markets. By offering more precise signals, this model helps traders make better decisions and minimize trading risks.
Success in applying this model requires practice and a deep understanding of market structure, but it can significantly improve trading performance.

ICT Unicorn Model [LuxAlgo]The ICT Unicorn Model indicator highlights the presence of "unicorn" patterns on the user's chart which is derived from the lectures of "The Inner Circle Trader" (ICT) .
Detected patterns are followed by targets with a distance controlled by the user.
🔶 USAGE
At its core, the ICT Unicorn Model relies on two popular concepts, Fair Value Gaps and Breaker Blocks. This combination highlights a future area of support/resistance.
A Bullish Unicorn Pattern consists out of:
A Lower Low (LL), followed by a Higher High (HH)
A Fair Value Gap (FVG), overlapping the established Breaker Block
A successful re-test of the FVG which confirms the pattern.
A Bearish Unicorn Pattern consists of:
A Higher High (HH), followed by a Lower Low (LL)
A Fair Value Gap (FVG), overlapping the established Breaker Block
A successful re-test of the FVG which confirms the pattern
The pattern detection depends on detected swings, which can be controlled by the Swing setting. Using higher values of this setting will return longer-term breaker blocks.
🔹 Using Risk/Reward Targets
A confirmed Unicorn pattern will show a blue ( Target ) / grey ( Stop Loss) "Risk/Reward" areas (RR).
When the Stop Loss or Target is hit, a white line is shown on the concerned side.
The Risk/Reward ratio can be adjusted in the "Targets" settings.
🔹 Trailing Stop
As seen in the previous snapshots, besides the RR areas, this indicator also includes an optional Trailing Stop .
This can be helpful to lower your risk, by exiting earlier than if you would wait until the Stop Loss is hit.
This example shows a successful bullish and bearish Unicorn Pattern . In this scenario, the Trailing Stop could be used for partial Take Profit.
The goal of this publication is to show confirmed Unicorn Patterns . To increase the chance of success, it is important to evaluate the bigger picture & use this in confluence with your price action analysis. For example, look for potential areas of liquidity, consider this pattern only during certain market sessions, avoid trading during heavy impact news, &/or incorporate other aspects of technical analysis rather than just following this pattern blindly.
🔶 DETAILS
🔹 Combine
When disabled, all potential Unicorn Patterns will delete previous unconfirmed patterns:
Enabling Combine ensures the last Unicorn Patterns in the opposite direction will remain.
While the latter bullish pattern became invalid, another one formed.
The combination of the previous bearish pattern, and looking at the big picture, the bullish pattern did not have much chance to be successful.
While disabling 'combine' helps minimize clutter, enabling this feature can give a pattern more chance to hit the SL/Target level.
🔹 Mitigated FVG
Users can determine if a pattern becomes invalid due to a mitigated FVG, causing the pattern to be deleted.
🔹 New pattern detected
When a new pattern is detected, the previous unconfirmed pattern in the same direction (bullish - bullish or bearish - bearish) will be deleted. This will always be the case, whether "Combine' is enabled or disabled.
When the previous pattern was confirmed but no SL or Target level was hit, this pattern will stop updating.
🔶 SETTINGS
🔹 Unicorn
Swings: This sets the length of swings, used for the underlying ZigZag and Unicorn Patterns detection.
Bull: Enable/disable Bullish patterns, and set the color of FVG box and Trailing Stop .
Bear: Enable/disable Bearish patterns, and set the color of FVG box and Trailing Stop .
Combine: When enabled, patterns in opposite directions (bullish/bearish) can exist at the same time. disabling this feature tends to give less clutter. See the "Usage" section for more information.
🔹 Targets
Risk/Reward: Sets the Risk/Reward ratio.
Trailing Stop: Set the length of small swings, which is used for the Trailing Stop .

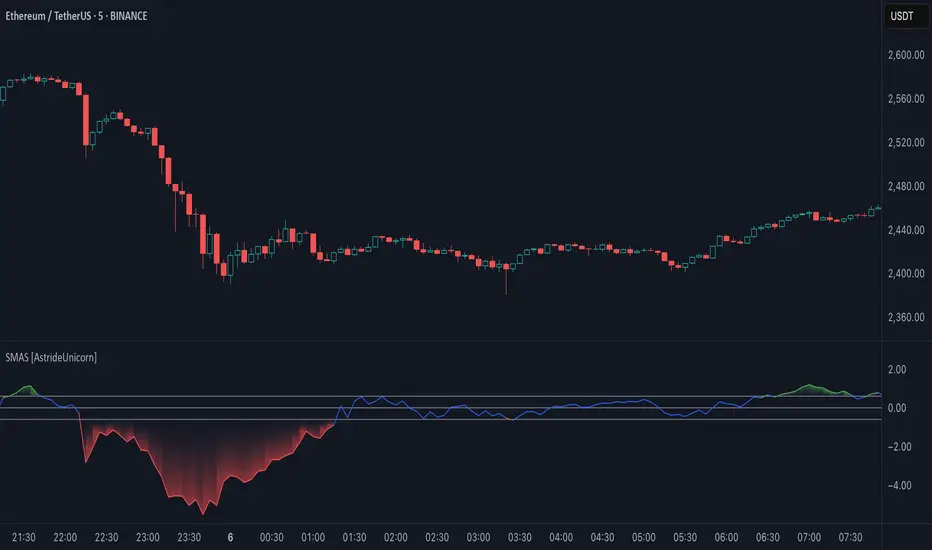
Simple Moving Average Slope [AstrideUnicorn]The Simple Moving Average Slope indicator (SMAS) is a technical analysis tool designed to help traders detect the direction and strength of the current trend in the price of an asset. It is also a great tool for identifying sideways markets. The indicator plots the slope of a simple moving average (SMA) of the closing prices over a specified time period. The slope is normalized by dividing it by the standard deviation of the slope over a longer time period.
HOW TO USE
Traders can use the Simple Moving Average Slope indicator in various ways. One common way is to look for bullish or bearish signals. A bullish signal occurs when the normalized slope rises above a predetermined threshold, resulting in the indicator turning green, indicating an upward trend in the market. Conversely, a bearish signal is generated when the normalized slope falls below the negative value of the threshold, causing the indicator to turn red, signaling a downtrend in the market. When the normalized slope falls between the positive and negative threshold values, a neutral signal is generated, indicating that the market is moving sideways. This can help traders avoid false trend signals from other indicators and strategies that may occur when the market is in a sideways regime. Additionally, traders can use the Simple Moving Average Slope indicator in conjunction with other technical indicators to confirm the trend direction.
SETTINGS
Window - specifies the number of bars used to calculate the SMA slope. The default value is 20.
Threshold - specifies the threshold value used to generate the bullish and bearish signals. The default value is 0.6. Traders can adjust these settings based on their trading strategy and the asset being analyzed.
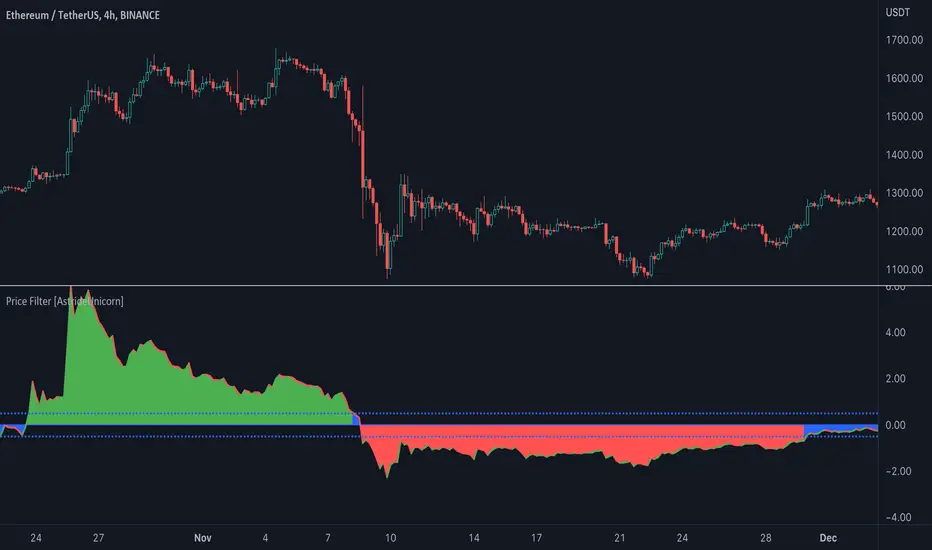
Price Filter [AstrideUnicorn]The indicator calculates a fast price filter based on the closing price of the underlying asset. Overall, it is intended to provide a fast, reliable way to detect trend direction and confirm trend strength, using statistical measures of price movements.
The algorithm was adapted from Marcus Schmidberger's (2018) article "High Frequency Trading with the MSCI World ETF". It demeans the price time series using the long-term average and then normalizes it with the long-term standard deviation. The resulting time series is then compared to specified thresholds to determine the trend direction.
HOW TO USE
The indicator surface is colored green if the price is trending upwards and red if the price is trending downwards. If the indicator outline is the opposite color of the indicator surface, it indicates that the price is moving against the trend and the current trend may be losing strength.
If the 'Use threshold' setting is enabled, the indicator will be colored blue if its value is within the range defined by the upper and lower thresholds. This indicates that the price is trending sideways, or that the current trend is losing strength.
SETTNGS
Length - the length of the long-term average used to calculate the price filter. Recommended range 20 - 200. The sensitivity of the indicator increases as the value becomes smaller, allowing it to detect smaller price moves and swings earlier.
Threshold - the threshold value used to detect trend direction.
Use threshold - a boolean (true/false) input that determines whether to use the threshold value for confirmation.