Mutanabby_AI | ONEUSDT_MR1
ONEUSDT Mean-Reversion Strategy | 74.68% Win Rate | 417% Net Profit
This is a long-only mean-reversion strategy designed specifically for ONEUSDT on the 1-hour timeframe. The core logic identifies oversold conditions following sharp declines and enters positions when selling pressure exhausts, capturing the subsequent recovery bounce.
Backtested Period: June 2019 – December 2025 (~6 years)
Performance Summary
| Metric | Value |
|--------|-------|
| Net Profit | +417.68% |
| Win Rate | 74.68% |
| Profit Factor | 4.019 |
| Total Trades | 237 |
| Sharpe Ratio | 0.364 |
| Sortino Ratio | 1.917 |
| Max Drawdown | 51.08% |
| Avg Win | +3.14% |
| Avg Loss | -2.30% |
| Buy & Hold Return | -80.44% |
Strategy Logic :
Entry Conditions (Long Only):
The strategy seeks confluence of three conditions that identify exhausted selling:
1. Prior Move Filter:*The price change from 5 bars ago to 3 bars ago must be ≥ -7% (ensures we're not entering during freefall)
2. Current Move Filter: The price change over the last 2 bars must be ≤ 0% (confirms momentum is stalling or reversing)
3. Three-Bar Decline: The price change from 5 bars ago to 3 bars ago must be ≤ -5% (confirms a significant recent drop occurred)
When all three conditions align, the strategy identifies a potential reversal point where sellers are exhausted.
Exit Conditions:
- Primary Exit: Close above the previous bar's high while the open of the previous bar is at or below the close from 9 bars ago (profit-taking on strength)
- Trailing Stop: 11x ATR trailing stop that locks in profits as price rises
Risk Management
- Position Sizing:Fixed position based on account equity divided by entry price
- Trailing Stop:11× ATR (14-period) provides wide enough room for crypto volatility while protecting gains
- Pyramiding:Up to 4 orders allowed (can scale into winning positions)
- **Commission:** 0.1% per trade (realistic exchange fees included)
Important Disclaimers
⚠️ This is NOT financial advice.
- Past performance does not guarantee future results
- Backtest results may contain look-ahead bias or curve-fitting
- Real trading involves slippage, liquidity issues, and execution delays
- This strategy is optimized for ONEUSDT specifically — results may differ on other pairs
- Always test before risking real capital
Recommended Usage
- Timeframe:*1H (as designed)
- Pair: ONEUSDT (Binance)
- Account Size: Ensure sufficient capital to survive max drawdown
Source Code
Feedback Welcome
I'm sharing this strategy freely for educational purposes. Please:
- Drop a comment with your backtesting results any you analysis
- Share any modifications that improve performance
- Let me know if you spot any issues in the logic
Happy trading
As a quant trader, do you think this strategy will survive in live trading?
Yes or No? And why?
I want to hear from you guys
การวิเคราะห์แนวโน้ม

ORB Strategy: Extensions & Custom SL (EOD & Live Lines)That's a great request. Since you've now built a complex Pine Script Strategy with several user-configurable risk management, targeting, and exit options, the description should focus on the systematic rules used for entering, managing, and exiting trades.
Here is a clear, written description of the trading strategy you have built:
Trading Strategy Description: ORB Extension Breakout with Custom Stop, Live Tracking, and EOD Exit
This strategy is a systematic, momentum-based system designed for intraday trading. It operates on the principle of an Opening Range Breakout (ORB), utilizing the initial market consolidation to project high-probability targets, while offering multiple methods for managing risk and enforcing a mandatory end-of-day closure.
1. Market Identification (The Opening Range)
The strategy first defines the market's initial boundaries and volatility:
Session Window: The strategy calculates the Opening Range (OR) over a user-defined time period (default: 9:30 AM to 10:30 AM New York Time).
ORB Levels: Two key price levels are established and locked once the time window closes:
Wick High/Low: The absolute highest and lowest prices of the session. These serve as the entry trigger lines.
Body High/Low (Shaded Range): The highest and lowest open/close prices of the session. The height of this range is used as the basis for calculating all targets and stops.
2. Entry Rule (The Breakout)
The strategy waits passively for a breakout that confirms direction and ensures the move has not yet reached its immediate target.
Trigger Condition: A trade is signaled when a candle closes either:
Above the Wick High (for a Long entry).
Below the Wick Low (for a Short entry).
Constraint (Fresh Breakout): The entry is invalidated if the breakout candle's price action (High for Long, Low for Short) has already touched or surpassed the projected Take Profit (0.5 Extension) level before the candle closes.
Execution: The entry is a Market Order executed on the candle that meets the trigger conditions, subject to a user-defined Entry Delay (default 0 bars).
Direction Control: The user can select to trade Long Only, Short Only, or Both.
3. Exit and Risk Management
All trades are placed with simultaneous Take Profit and Stop Loss orders (a bracket order) upon entry.
A. Take Profit (TP)
The Take Profit is set at the 0.5 Extension of the Shaded Range (Body Range).
Calculation: The distance from the Body High/Low to the TP level is exactly 50% of the total height of the Shaded Range.
B. Stop Loss (SL)
The Stop Loss is dynamically calculated based on a user-selected method for risk control:
Range 0.5 (Body Range): The SL is placed an equal distance (0.5 times the Body Range height) outside the opposite side of the Body Range.
ATR Multiple: The Stop Loss distance is calculated as a user-defined Multiplier times the Average True Range (ATR).
Recent Swing Low/High: The Stop Loss is placed based on a structural low (for Long) or high (for Short) within a user-defined lookback period.
C. End-of-Day (EOD) Exit
Any open position is forced closed at the market price if it is still open when the user-defined closing time (default: 16:00 HHMM) is reached. This prevents carrying intraday risk overnight.
4. Visualization
The strategy includes comprehensive visual cues for analysis:
ORB Drawing: Displays the Wick High/Low and the shaded Body Range.
Breakout Signals: Highlights the specific bar where the validated entry signal occurs.
Closed Trades: Draws persistent lines for the Entry and Exit prices of the last few closed trades.
Live Open Trades: Draws persistent lines for the current Entry Price, active Take Profit Level, and active Stop Loss Level for any open position.

[SM-021] Gaussian Trend System [Optimized]This script is a comprehensive trend-following strategy centered around a Gaussian Channel. It is designed to capture significant market movements while filtering out noise during consolidation phases. This version (v2) introduces code optimizations using Pine Script v6 Arrays and a new Intraday Time Control feature.
1. Core Methodology & Math
The foundation of this strategy is the Gaussian Filter, originally conceptualized by @DonovanWall.
Gaussian Poles: Unlike standard moving averages (SMA/EMA), this filter uses "poles" (referencing signal processing logic) to reduce lag while maintaining smoothness.
Array Optimization: In this specific iteration, the f_pole function has been refactored to utilize Pine Script Arrays. This improves calculation efficiency and rendering speed compared to recursive variable calls, especially when calculating deep historical data.
Channel Logic: The strategy calculates a "Filtered True Range" to create High and Low bands around the main Gaussian line.
Long Entry: Price closes above the High Band.
Short Entry: Price closes below the Low Band.
2. Signal Filtering (Confluence)
To reduce false signals common in trend-following systems, the strategy employs a "confluence" approach using three additional layers:
Baseline Filter: A 200-period (customizable) EMA or SMA acts as a regime filter. Longs are only taken above the baseline; Shorts only below.
ADX Filter (Volatility): The Average Directional Index (ADX) is used to measure trend strength. If the ADX is below a user-defined threshold (default: 20), the market is considered "choppy," and new entries are blocked.
Momentum Check: A Stochastic RSI check ensures that momentum aligns with the breakout direction.
3. NEW: Intraday Session Filter
Per user requests, a time-based filter has been added to restrict trading activity to specific market sessions (e.g., the New York Open).
How it works: Users can toggle a checkbox to enable/disable the filter.
Configuration: You can define a specific time range (Default: 09:30 - 16:00) and a specific Timezone (Default: New York).
Logic: The strategy longCondition and shortCondition now check if the current bar's timestamp falls within this window. If outside the window, no new entries are generated, though existing trades are managed normally.
4. Risk Management
The strategy relies on volatility-based exits rather than fixed percentage stops:
ATR Stop Loss: A multiple of the Average True Range (ATR) is calculated at the moment of entry to set a dynamic Stop Loss.
ATR Take Profit: An optional Reward-to-Risk (RR) ratio can be set to place a Take Profit target relative to the Stop Loss distance.
Band Exit: If the trend reverses and price crosses the opposite band, the trade is closed immediately to prevent large drawdowns.
Credits & Attribution
Original Gaussian Logic: Developed by @DonovanWalll. This script utilizes his mathematical formula for the pole filters.
Strategy Wrapper & Array Refactor: Developed by @sebamarghella.
Community Request: The Intraday Session Filter was added to assist traders focusing on specific liquidity windows.
Disclaimer: This strategy is for educational purposes. Past performance is not indicative of future results. Please use the settings menu to adjust the Session Time and Risk parameters to fit your specific asset class.

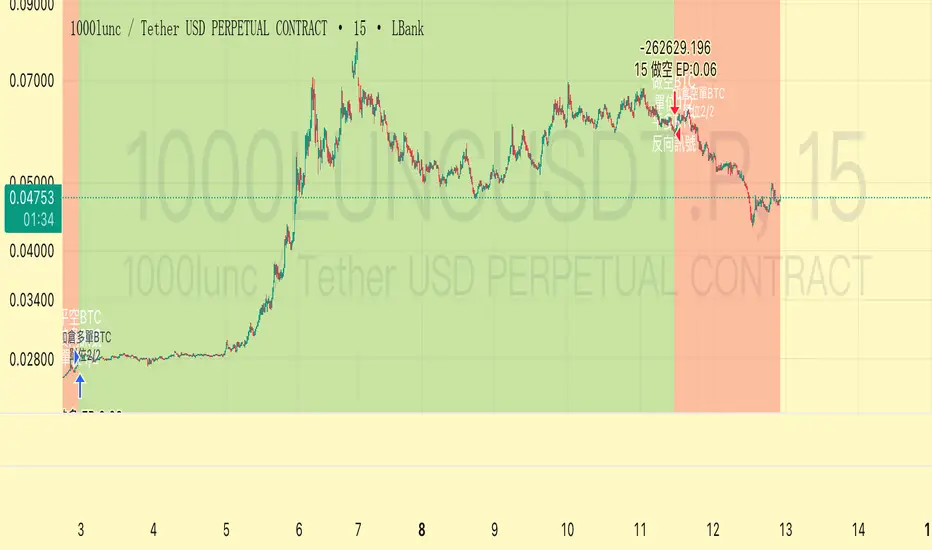
Trend Following $ZEC - Multi-Timeframe Structure Filter + Revers# Trend Following CRYPTOCAP:ZEC - Strategy Guide
## 📊 Strategy Overview
Trend Following CRYPTOCAP:ZEC is an enhanced Turtle Trading system designed for cryptocurrency spot trading, combining Donchian Channel breakouts, multi-timeframe structure filtering, and ATR-based dynamic risk management for both long and short positions.
---
## 🎯 Core Features
1. Multi-Timeframe Structure Filtering
- Uses Swing High/Low to identify market structure
- Customizable structure timeframe (default: 1 minute)
- Only enters trades in the direction of the trend, avoiding counter-trend positions
2. Reverse Signal Exit
- No fixed stop-loss or fixed-period exits
- Exits only when a reverse entry signal triggers
- Maximizes trend profits, reduces premature exits
3. ATR Dynamic Pyramiding
- Adds positions when price moves 0.5 ATR in favorable direction
- Supports up to 2 units maximum (adjustable)
- Pyramid scaling to enhance profitability
4. Complete Risk Management
- Fixed position size (5000 USD per unit)
- Commission fee 0.06% (Binance spot rate)
- Initial capital 10,000 USD
---
## 📈 Trading Logic
Entry Conditions
✅ Long Entry:
- Close price breaks above 20-period high
- Structure trend is bullish (price breaks above Swing High)
✅ Short Entry:
- Close price breaks below 20-period low
- Structure trend is bearish (price breaks below Swing Low)
Add Position Conditions
- Long: Price rises ≥ 0.5 ATR
- Short: Price falls ≥ 0.5 ATR
- Maximum 2 units including initial entry
Exit Conditions
- Long Exit: When short entry signal triggers (price breaks 20-period low + structure turns bearish)
- Short Exit: When long entry signal triggers (price breaks 20-period high + structure turns bullish)
---
## ⚙️ Parameter Settings
Channel Settings
- Entry Channel Period: 20 (Donchian Channel breakout period)
- Exit Channel Period: 10 (reserved parameter, actually uses reverse signal exit)
ATR Settings
- ATR Period: 20
- Stop Loss ATR Multiplier: 2.0 (reserved parameter)
- Add Position ATR Multiplier: 0.5
Structure Filter
- Swing Length: 160 (Swing High/Low calculation period)
- Structure Timeframe: 1 minute (can change to 5/15/60, etc.)
Position Management
- Maximum Units: 2 (including initial entry)
- Capital Per Unit: 5000 USD
---
## 🎨 Visualization Features
Background Colors
- Light Green: Bullish structure
- Light Red: Bearish structure
- Dark Green: Long entry
- Dark Red: Short entry
Optional Display (Default: OFF)
- Entry/exit channel lines
- Structure high/low lines
- ATR stop-loss line
- Next add position indicator
- Entry/exit labels
---
## 📱 Alert Message Format
Strategy sends notifications on entry/exit with the following format:
- Entry: `1m Long EP:428.26`
- Add Position: `15m Add Long 2/2 EP:429.50`
- Exit: `1m Close Long Reverse Signal`
Where:
- `1m`/`15m` = Current chart timeframe
- `EP` = Entry Price
---
## 💰 Backtest Settings
Capital Allocation
- Initial Capital: 10,000 USD
- Per Entry: 5,000 USD (split into 2 entries)
- Leverage: 0x (spot trading)
Trading Costs
- Commission: 0.06% (Binance spot VIP0)
- Slippage: 0
---
## 🎯 Use Cases
✅ Best Scenarios
- Trending markets
- Moderate volatility assets
- 1-minute to 4-hour timeframes
⚠️ Not Suitable For
- Highly volatile choppy markets
- Low liquidity small-cap coins
- Extreme market conditions (black swan events)
---
## 📊 Usage Recommendations
Timeframe Suggestions
| Timeframe | Trading Style | Suggested Parameter Adjustment |
|-----------|--------------|-------------------------------|
| 1-5 min | Scalping | Swing Length 100-160 |
| 15-30 min | Short-term | Swing Length 50-100 |
| 1-4 hour | Swing Trading | Swing Length 20-50 |
Optimization Tips
1. Adjust swing length based on backtest results
2. Different coins may require different parameters
3. Recommend backtesting on 1-minute chart first before live trading
4. Enable labels to observe entry/exit points
---
## ⚠️ Risk Disclaimer
1. Past Performance Does Not Guarantee Future Results
- Backtest data is for reference only
- Live trading may be affected by slippage, delays, etc.
2. Market Condition Changes
- Strategy performs better in trending markets
- May experience frequent stops in ranging markets
3. Capital Management
- Do not invest more than you can afford to lose
- Recommend setting total capital stop-loss threshold
4. Commission Impact
- Frequent trading accumulates commission fees
- Recommend using exchange discounts (BNB fee reduction, etc.)
---
## 🔧 Troubleshooting
Q: No entry signals?
A: Check if structure filter is too strict, adjust swing length or timeframe
Q: Too many labels displayed?
A: Turn off "Show Labels" option in settings
Q: Poor backtest performance?
A:
1. Check if the coin is suitable for trend-following strategies
2. Adjust parameters (swing length, channel period)
3. Try different timeframes
Q: How to set alerts?
A:
1. Click "Alert" in top-right corner of chart
2. Condition: Select "Strategy - Trend Following CRYPTOCAP:ZEC "
3. Choose "Order filled"
4. Set notification method (Webhook/Email/App)
---
## 📞 Contact Information
Strategy Name: Trend Following CRYPTOCAP:ZEC
Version: v1.0
Pine Script Version: v6
Last Updated: December 2025
---
## 📄 Copyright Notice
This strategy is for educational and research purposes only.
All risks of using this strategy for live trading are borne by the user.
Commercial use without authorization is prohibited.
---
## 🎓 Learning Resources
To understand the strategy principles in depth, recommended reading:
- "The Complete TurtleTrader" - Curtis Faith
- "Trend Following" - Michael Covel
- TradingView Pine Script Official Documentation
---
Happy Trading! Remember to manage your risk 📈

Trend Following $BTC - Multi-Timeframe Structure + ReversTREND FOLLOWING STRATEGY - MULTI-TIMEFRAME STRUCTURE BREAKOUT SYSTEM
Strategy Overview
This is an enhanced Turtle Trading system designed for cryptocurrency spot trading. It combines Donchian Channel breakouts with multi-timeframe structure filtering and ATR-based dynamic risk management. The strategy trades both long and short positions using reverse signal exits to maximize trend capture.
Core Features
Multi-Timeframe Structure Filtering
The strategy uses Swing High/Low analysis to identify market structure trends. You can customize the structure timeframe (default: 3 minutes) to match your trading style. Only enters trades aligned with the identified trend direction, avoiding counter-trend positions that often lead to losses.
Reverse Signal Exit System
Instead of using fixed stop-losses or time-based exits, this strategy exits positions only when a reverse entry signal triggers. This approach maximizes trend profits and reduces premature exits during normal market retracements.
ATR Dynamic Pyramiding
Automatically adds positions when price moves 0.5 ATR in your favor. Supports up to 2 units maximum (adjustable). This pyramid scaling enhances profitability during strong trends while maintaining disciplined risk management.
Complete Risk Management
Fixed position sizing at 5000 USD per unit. Includes realistic commission fees of 0.06% (Binance spot rate). Initial capital set at 10,000 USD. All backtest parameters reflect real-world trading conditions.
Trading Logic
Entry Conditions
Long Entry: Close price breaks above the 20-period high AND structure trend is bullish (price breaks above Swing High)
Short Entry: Close price breaks below the 20-period low AND structure trend is bearish (price breaks below Swing Low)
Position Scaling
Long positions: Add when price rises 0.5 ATR or more
Short positions: Add when price falls 0.5 ATR or more
Maximum 2 units including initial entry
Exit Conditions
Long Exit: Triggers when short entry signal appears (price breaks 20-period low + structure turns bearish)
Short Exit: Triggers when long entry signal appears (price breaks 20-period high + structure turns bullish)
Default Parameters
Channel Settings
Entry Channel Period: 20 (Donchian Channel breakout period)
Exit Channel Period: 10 (reserved parameter)
ATR Settings
ATR Period: 20
Stop Loss ATR Multiplier: 2.0
Add Position ATR Multiplier: 0.5
Structure Filter
Swing Length: 300 (Swing High/Low calculation period)
Structure Timeframe: 3 minutes
Adjust these based on your trading timeframe and asset volatility
Position Management
Maximum Units: 2 (including initial entry)
Capital Per Unit: 5000 USD
Visualization Features
Background Colors
Light Green: Bullish market structure
Light Red: Bearish market structure
Dark Green: Long position entry
Dark Red: Short position entry
Optional Display Elements (Default: OFF)
Entry and exit channel lines
Structure high/low reference lines
ATR stop-loss indicator
Next position add level
Entry/exit labels
Alert Message Format
The strategy sends notifications with the following format:
Entry: "5m Long EP:90450.50"
Add Position: "15m Add Long 2/2 EP:91000.25"
Exit: "5m Close Long Reverse Signal"
Where the first part shows your current chart timeframe and EP indicates Entry Price
Backtest Settings
Capital Allocation
Initial Capital: 10,000 USD
Per Entry: 5,000 USD (split into 2 potential entries)
Leverage: 0x (spot trading only)
Trading Costs
Commission: 0.06% (Binance spot VIP0 rate)
Slippage: 0 (adjust based on your experience)
Best Use Cases
Ideal Scenarios
Trending markets with clear directional movement
Moderate to high volatility assets
Timeframes from 1-minute to 4-hour charts
Best suited for major cryptocurrencies with good liquidity
Not Recommended For
Highly volatile choppy/ranging markets
Low liquidity small-cap coins
Extreme market conditions or black swan events
Usage Recommendations
Timeframe Guidelines
1-5 minute charts: Use for scalping, consider Swing Length 100-160
15-30 minute charts: Good for short-term trading, Swing Length 50-100
1-4 hour charts: Suitable for swing trading, Swing Length 20-50
Optimization Tips
Always backtest on historical data before live trading
Adjust swing length based on asset volatility and your timeframe
Different cryptocurrencies may require different parameter settings
Enable visualization options initially to understand entry/exit points
Monitor win rate and drawdown during backtesting
Technical Details
Built on Pine Script v6
No repainting - uses proper bar referencing with offset
Prevents lookahead bias with lookahead=off parameter
Strategy mode with accurate commission and slippage modeling
Multi-timeframe security function for structure analysis
Proper position state tracking to avoid duplicate signals
Risk Disclaimer
This strategy is provided for educational and research purposes only. Past performance does not guarantee future results. Backtesting results may differ from live trading due to slippage, execution delays, and changing market conditions. The strategy performs best in trending markets and may experience drawdowns during ranging conditions. Always practice proper risk management and never risk more than you can afford to lose. It is recommended to paper trade first and start with small position sizes when going live.
How to Use
Add the strategy to your TradingView chart
Select your desired timeframe (1m to 4h recommended)
Adjust parameters based on your risk tolerance and trading style
Review backtest results in the Strategy Tester tab
Set up alerts for automated notifications
Consider paper trading before risking real capital
Tags
Trend Following, Turtle Trading, Donchian Channel, Structure Breakout, ATR, Cryptocurrency, Spot Trading, Risk Management, Pyramiding, Multi-Timeframe Analysis
---
Strategy Name: Trend Following BTC
Version: v1.0
Pine Script Version: v6
Last Updated: December 2025
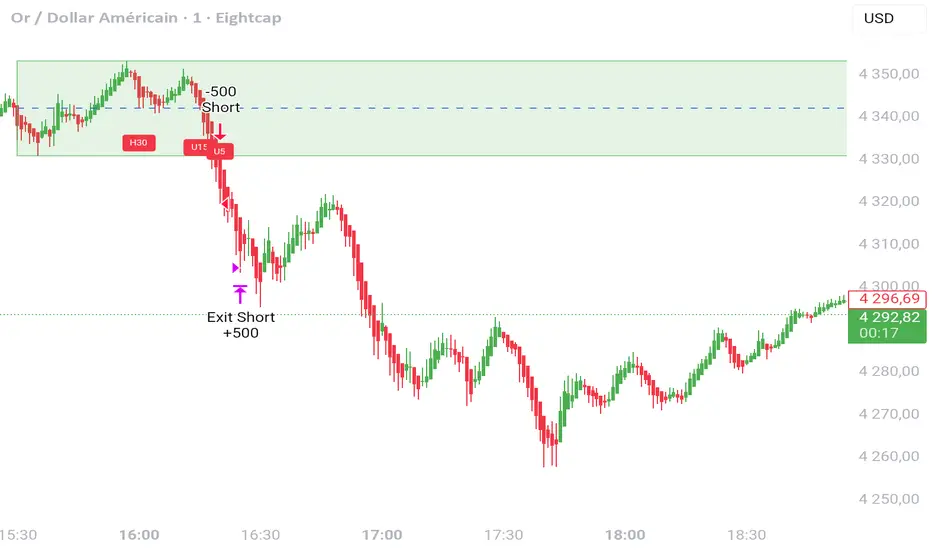
DR/IDR Break .5 TPDR/IDR Extension Breakout with Custom Stop
This strategy is a systematic, counter-trend, and momentum-based system designed for intraday trading. It operates on the principle of an Opening Range Breakout (ORB), utilizing the initial market consolidation to project high-probability targets, while offering multiple methods for managing risk.
1. Market Identification (The Opening Range)
The strategy begins by defining the market's initial boundaries and volatility:
Session Window: The strategy calculates the Opening Range (OR) over a user-defined time period (default: 9:30 AM to 10:30 AM New York Time).
ORB Levels: Two key price levels are established and locked once the time window closes:
Wick High/Low: The absolute highest and lowest prices of the session. These serve as the entry trigger lines.
Body High/Low (Shaded Range): The highest and lowest open/close prices of the session. The height of this range is used to calculate the Take Profit and Stop Loss levels.
2. Entry Rule (The Breakout)
The strategy is passive until the range is violated, looking for a strong move out of the consolidation area.
Trigger Condition: A trade is signaled when a candle closes either:
Above the Wick High (for a Long entry).
Below the Wick Low (for a Short entry).
Execution: The entry is a Market Order executed on the candle that meets the trigger condition, subject to a user-defined Entry Delay (default 0 bars, meaning the entry is taken immediately upon the breakout candle's close).
Direction Control: The user can select to trade Long Only, Short Only, or Both.
3. Exit and Risk Management
All trades are placed with simultaneous Take Profit and Stop Loss orders (a bracket order) once the entry is filled.
A. Take Profit (TP)
The Take Profit is set at the 0.5 Extension of the Shaded Range (Body Range).
Calculation: The distance from the Body High/Low to the TP level is exactly 50% of the total height of the Shaded Range.
B. Stop Loss (SL)
The Stop Loss is dynamically calculated based on a user-selected method for risk control:
Range 0.5 (Body Range): The Stop Loss is placed an equal distance (0.5 times the Body Range height) outside the opposite side of the Body Range.
Example (Long): If entry is above the Wick High, the SL is set 0.5 times the Body Range height below the Body Low.
ATR Multiple: The Stop Loss distance is determined by the asset's recent volatility.
Calculation: The distance is calculated as a user-defined Multiplier (default 2.0) times the Average True Range (ATR).
Recent Swing Low/High: The Stop Loss is placed based on a structural level defined by recent price action.
Long Entry: SL is placed at the Lowest Swing Low within a user-defined lookback period.
Short Entry: SL is placed at the Highest Swing High within a user-defined lookback period.
Summary of Workflow
The market sets the Wick and Body boundaries (e.g., 9:30–10:30 AM).
Price breaks and closes beyond a Wick boundary, triggering a signal.
The trade enters after the specified delay.
A bracket order is placed: TP is fixed at the 0.5 Extension, and SL is set based on the user's chosen risk method.
The trade is closed upon reaching either the TP or the SL level.

Sinals 15m - RSI 7 e 9This strategy is designed to capture continuation moves on the 15-minute chart by combining trend filters, momentum indicators, and strong-candle confirmation. The core idea is to enter trades shortly after EMA crossovers that signal direction, as long as momentum and candle strength support the move.

Volatility Trend FollowerThe script combines several classic technical analysis techniques:
SuperTrend / Adaptive Band - The main idea comes from the SuperTrend indicator, which uses ATR (Average True Range) to create a trailing band that adapts to volatility
ATR (Average True Range) - A volatility measure developed by J. Welles Wilder Jr.
EMA (Exponential Moving Average) - Used as a global trend filter
Heikin Ashi - An option to smooth prices and reduce noise

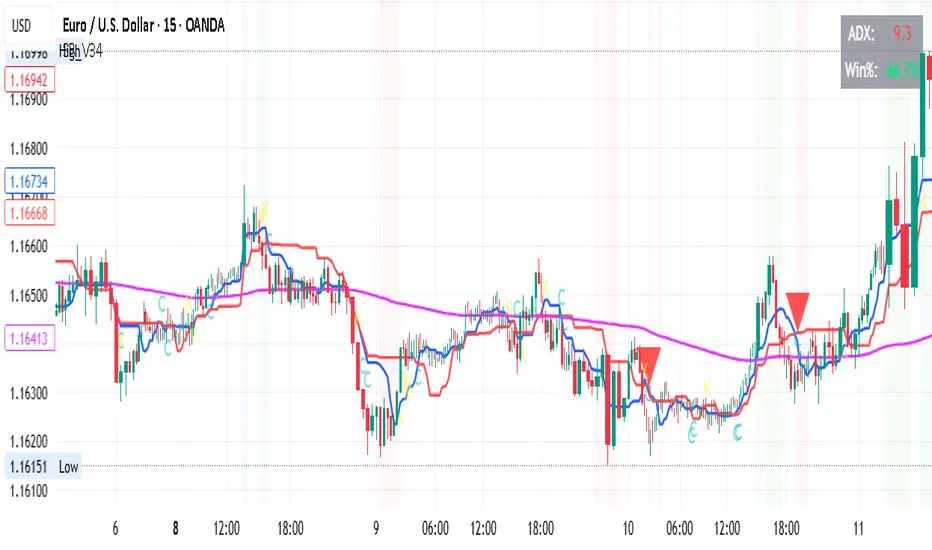
OPTIMISED FOR 15Min on certain FOREX Ichimoku & Friends Strategy
Timeframe
15-Minute Chart
Entry Rules
Required Conditions ALL Must Be True
For LONG Entries:
Trend: Price is above EMA 200 (purple line)
Ichimoku: Tenkan (blue) is above Kijun (red)
Price Position: Close is above BOTH Tenkan AND Kijun
ADX: Must be above 22 (shows strong trend)
RSI: Between 50 and 70 (has momentum, not overbought)
Cooldown: At least 12 bars since last trade closed
For SHORT Entries:
Trend: Price is below EMA 200 (purple line)
Ichimoku: Tenkan (blue) is below Kijun (red)
Price Position: Close is below BOTH Tenkan AND Kijun
ADX: Must be above 22 (shows strong trend)
RSI: Between 30 and 50 (has momentum, not oversold)
Cooldown: At least 12 bars since last trade closed
Entry Signals Any ONE of These
Signal Type 1: Cross (C)
Long: Tenkan crosses above Kijun AND price closes above Kijun
Short: Tenkan crosses below Kijun AND price closes below Kijun
Wait 1 bar to confirm the cross holds
Signal Type 2: Bounce (B) - Most Reliable
Long: Price touches/dips to Kijun, then bounces up with strong bullish candle
Short: Price touches/spikes to Kijun, then rejects down with strong bearish candle
Must occur within last 3 bars
Signal Type 3: Breakout (K)
Long: Price breaks above Kijun with strong bullish momentum candle
Short: Price breaks below Kijun with strong bearish momentum candle
Candle body must be at least 40% of ATR
Risk Management
Stop Loss Placement
Placed at the lower of:
Recent swing low (last 5 bars) for longs
Kijun minus 0.5 ATR for longs
Minimum distance: 2.5 x ATR
FOR SHORTS: Mirror logic using swing highs
Take Profit
2x the stop loss distance
Example: If stop is 20 pips away, target is 40 pips
Position Size
100% of equity per trade (as per current settings)
Adjust based on your risk tolerance
Trade Management
When to Enter
Only when ALL entry conditions are met
Check that background is shaded (green for long, red for short)
Small letter markers (C, B, K) show which signal type triggered
When to Exit
Take Profit hit (2x R:R ratio)
Stop Loss hit (smart placement protects capital)
Strategy closes position (conditions reverse)
Cooldown Period
Wait 12 bars (3 hours on 15m chart) after any trade closes
Prevents revenge trading and overtrading
Visual Indicators on Chart
Lines
Blue (Tenkan): 9-period conversion line
Red (Kijun): 26-period base line
Purple (EMA 200): Long-term trend line
Orange (EMA 50): Not used in current rules
Signals
Large Green Triangle Up: LONG entry
Large Red Triangle Down: SHORT entry
Small Letters (C/B/K): Which signal type triggered
Background Colors
Light Green: Conditions favorable for LONG (ADX good, uptrend)
Light Red: Conditions favorable for SHORT (ADX good, downtrend)
No Color: Not safe to trade
Top Right Display
ADX Value: Green = above threshold, Red = below
Win Rate: Shows current performance
Quick Checklist Before Entry
LONG Trade Checklist:
Price above purple EMA 200
Blue line above red line
Price above both blue AND red lines
ADX number is green (above 22)
RSI between 50-70
Background is light green
At least 12 bars since last trade
Signal marker appeared (triangle or letter)
SHORT Trade Checklist:
Price below purple EMA 200
Blue line below red line
Price below both blue AND red lines
ADX number is green (above 22)
RSI between 30-50
Background is light red
At least 12 bars since last trade
Signal marker appeared (triangle or letter)
Tips for Success
Best Signal Type: Bounce (B) signals typically have highest win rate
ADX is Critical: Do not trade when ADX is red - wait for trends
Be Patient: 2-3 trades per day on 15m is normal and healthy
Trust the System: Do not second-guess the signals
Respect Cooldown: Waiting prevents emotional trading
Monitor Win Rate: Keep above 50% for profitability with 2:1 R:R
Adjustable Settings
If you want to modify strategy performance:
For Higher Win Rate Fewer Trades:
Increase "Minimum ADX" to 25
Increase "Cooldown Bars" to 15
Turn OFF breakout signals
For More Trades Slightly Lower Win Rate:
Decrease "Minimum ADX" to 20
Decrease "Cooldown Bars" to 8
Keep all signal types enabled
For Better Risk:Reward:
Increase "Risk:Reward Ratio" to 2.5 or 3.0
This means bigger targets, letting winners run more
What NOT to Do
Do not trade without ADX confirmation (when number is red)
Do not enter during cooldown period
Do not trade when price is chopping around EMA 200
Do not override the stop loss - let it work
Do not take signals when Tenkan and Kijun are flat/parallel
Do not force trades - wait for all conditions
Do not trade if you see no background shading
Notes
Current Performance: 67% win rate (2/3 trades)
Timeframe: 15-minute (3 hours = 12 bars cooldown)
Profit Factor Target: Above 1.5 is excellent
Strategy works best during: European and US trading sessions when volatility is higher
DYOR NFA
2 Dip/Tepe + Destek/Direnç + Tek Sinyal Stratejisi⭐ A Brief Summary of What the Strategy Does
🎯 1) Market analysis is being released (bottom-top analysis)
It automatically finds pivot bottoms and pivot tops on the strategic chart. Then:
If the bottoms are rising (HL – High Low): the trend is upward
If the tops are falling (LH – Lower High): the trend is downward
it interprets this.
🎯 2) Support and resistance lines are formed
Last pivot top = resistance line
Last pivot bottom = support line
These lines are automatically drawn on the chart.
🎯 3) Breakout is expected according to the trend structure
For LONG:
The last two bottoms will be rising bottoms
The price will rise above the last resistance line
This gives a single LONG signal.
For SHORT:
The last two peaks will be falling peaks
The price will fall below the support line
This gives a single SHORT signal.

Scalping EMA + Pinbar Strategy (London & NY only, BE @ 1R)The scalping trading system uses two types of indicators:
EMA 10, EMA 21, EMA 50
Pinbar Indicator
Rules for entering a buy order:
If the closing price is above the EMA 50, the trend is uptrend and only buy orders should be considered.
The EMA 10 and EMA 21 lines must simultaneously be above the EMA 50.
The price must correct down at least 50% of the area created by the EMA 10 and EMA 21, or correct further down.
A Type 1 Pinbar candle (marked by the Pinbar indicator) must appear; this Pinbar candle must react to at least one of the three EMA lines (EMA 10, EMA 21, EMA 50) and close above the EMA 50.
This Pinbar candle must have a Pinbar strength value (marked by the Pinbar indicator) less than 2 to be considered valid. Check if the closing price of this pinbar candle is higher than the 50-day EMA and if the 10-day and 21-day EMAs are also higher than the 50-day EMA. If so, the conditions have been met and you can begin trading.
Place a buy stop order 0.1 pip higher than the highest price of the pinbar candle, and a stop loss order 0.1 pip lower than the lowest price of the pinbar candle. Set the take profit at 3R.
If the price moves past the previously set stop loss, cancel the pending order.
When the price moves 1R, move the stop loss back to the entry point.
The next trade can only be executed after the previous trade has moved the stop loss back to the entry point.
Rules for placing sell orders:
If the closing price is below the 50-day EMA, the trend is bearish, and only sell orders should be considered. The 10-day and 21-day EMAs must both be below the 50-day EMA.
The price must correct downwards by at least 50% of the area formed by the 10-day and 21-day EMAs, or even further.
A Type 1 pinbar candle (marked by the Pinbar indicator) must appear. This pinbar candle must react to at least one of the three EMAs (EMA 10, EMA 21, EMA 50) and close below the EMA 50.
This pinbar is valid if its strength (indicated by the Pinbar indicator) is less than 2. Verify that the closing price of this pinbar candle is below the EMA 50 and that both the EMA 10 and EMA 21 are below the EMA 50. If all conditions are met, the trade can be executed.
(This appears to be a separate entry rule and not part of the previous text.) Place a sell stop order 0.1 pip below the lowest point of the pinbar candle, and a stop loss order 0.1 pip above the highest point of the pinbar candle. Set the take profit point at 3R.
If the price moves past the previously set stop-loss point, cancel the pending order.
When the price moves 1R, move the stop-loss point back to the entry point.
The next trade can only be executed after the previous trade has moved the stop-loss point back to the entry point.

AlphaGen ME V.15.12AlphaGen ME V.15.10 is an ATR-based trend-following strategy with dynamic trailing stops and EMA filter, designed for automated Crypto perpetual trading.
Core Logic:
• ATR Trailing Stops: Dynamically adjusts stop-loss using ATR(10) × 3.0 multiplier
• 200 EMA Trend Filter: Optional Only takes longs above EMA, shorts below EMA
• Reversal System: Flips positions when trend changes (filter-aware)
• MACD Acceleration Exit: Optional momentum-based profit taking
Position Sizing Modes:
• Simple % of Equity (default 90%) - Safe leverage control
• Risk % of Equity - Fixed risk per trade
• Fixed Contract Size - Consistent lot sizing
Webhook Integration:
Routes signals directly to AlphaGen-AI for execution on:
• Hyperliquid DEX
• AsterDEX
Requirements:
• AlphaGen-AI Pro subscription for webhook routing
• Hyperliquid or AsterDEX Wallets
• TradingView alerts configured with passphrase
Risk Disclosure: Trading involves substantial risk. Past performance does not guarantee future results. Only trade with capital you can afford to lose.

DAX-30 ATRXVersion 1 of DAX-30 ATRX algo.
Revised versions may be available in future.
To be used on the 45 minute timeframe only.
Algorithm is also profitable on the NAS100 - but use with caution.
Optimized Settings:
Higher-TF for trend bias - 4 hours
HTF EMA length - 5
Min HA body size (pts) - 0.5
RSI length - 14
RSI threshold for longs - 40
Fisher length - 11
Volume MA length - 20
Volume spike multiplier - 1.2
ATR length - 14
ATR-mean length - 80
Min ATR / ATR_mean multiplier - 0.8
Max ATR / ATR_mean multiplier - 2.5
SL = ATR x - 0.9
TP = ATR x - 2.1
NY Session ON
Max trades per day - 1

30min First Candle + Fibo50 + Sequential Multi-TF Break StrategyPrice action basée sur ouverture marché US a partir de la 1ere bougie
Réinitialisation chaque jour
Price action based on US market opening from 1st candle
Reset every day.

30min First Candle + Fibo50 + Sequential Multi-TF Break StrategyPrice action basée sur ouverture marché US avec Réinitialisation chaque jour
Quantum X StrategyQuantum X Strategy
Designed for: MIDCPNIFTY (15-minute timeframe)
🔍 Overview
Quantum X Strategy is a structured, rule-driven trading framework built to identify directional strength and controlled trend phases.
The strategy evaluates market behavior through a layered confirmation model and executes trades only when multiple internal conditions align.
🧠 Concept (High-Level Only — Safe for Publishing)
Quantum X uses a multi-filter decision engine that reacts to trend formation, momentum alignment, and market stability.
To maintain the script’s confidentiality, the internal formula, thresholds, and sequencing logic remain intentionally abstracted.
What users need to know:
It filters weak trend phases
It waits for synchronized directional confirmation
It avoids entries in unstable or noisy price zones
It focuses on capturing structured intraday swings
(TradingView fully allows this level of conceptual explanation.)
⚙️ How the Strategy Operates
Without revealing internal code, here is the functional behavior:
Evaluates directional bias with layered filters
Confirms market strength before execution
Automates both entry and exit management
Applies time-based and condition-based protective rules
Works best in instruments that show clean intraday rotation
📌 Intended Use
While users may experiment freely, this strategy is designed for MIDCPNIFTY on the 15-minute timeframe, as the internal structure aligns well with this instrument’s behavior pattern.
🛡️ Important Notes
This script is for research and systematic testing.
No future returns or performance are guaranteed.
Users should validate settings before applying in live markets.
All internal logic is protected by closed-source compilation.

ETH UU Reversion Strategy [Limit]Strategy Overview
The "ETH UU Reversion Strategy" is a sophisticated mean-reversion trading system designed to capture price reversals at standard deviation extremes. Unlike typical strategies that enter trades immediately at market price, this script employs a proprietary **Limit Order Execution Mechanism** combined with volatility filtering to optimize entry prices and reduce slippage.
Originality & Key Features
This script addresses the common pitfalls of standard Bollinger Band strategies by introducing advanced order management logic:
1. Limit Order Execution:** Instead of market orders, the strategy calculates an optimal entry price based on ATR offsets. This allows traders to capitalize on "wicks" and secure better risk-reward ratios.
2. Smart Timeout Logic:To prevent "catching a falling knife," pending orders are automatically cancelled if not filled within a customizable number of bars (default: 15). This ensures orders do not remain active when market structure shifts.
3. Dynamic Risk Recalculation:** Stop Loss (SL) and Take Profit (TP) levels are recalculated at the exact moment of execution using the real-time ATR, ensuring risk parameters adapt to current market volatility.
How to Use
1. Setup: Apply the strategy to ETH/USDT (or other crypto pairs) on 15m or 1h timeframes.
2. Configuration:
* Adjust `BB Length` and `RSI Length` to fit your timeframe.
* Set `Order Timeout` to define how long a pending order should remain active.
* Toggle `Use ADX Filter` to avoid trading against strong trends.
3. *Visuals: The chart displays distinct labels for pending orders (Gray), active entries (Blue/Red), and cancellations, providing full transparency of the strategy's logic.
Risk Disclaimer
This script is for educational and quantitative analysis purposes only. Past performance regarding backtesting or live trading does not guarantee future results. Cryptocurrency trading involves high risk and high volatility. Please use proper risk management and trade at your own discretion.
-------------------------------------------------------------
Chinese Translation (中文说明)
策略概述
“ETH UU 均值回归策略”是一个旨在捕捉标准差极端位置价格反转的交易系统。与立即以市价入场的典型策略不同,本策略采用独特的**挂单执行机制**结合波动率过滤,以优化入场价格并减少滑点。
原创性与核心功能
本脚本通过引入高级订单管理逻辑,解决了普通布林带策略的常见缺陷:
1. 挂单交易模式: 策略不使用市价单,而是根据 ATR 偏移计算最佳入场价(Limit Orders)。这允许交易者捕捉K线的“影线”,获得更好的盈亏比。
2. 智能超时撤单: 为了防止“接飞刀”,如果挂单在指定K线数内(默认15根)未成交,系统会自动撤单。这确保了当市场结构发生变化时,旧的挂单不会被错误触发。
3. 动态风控重算: 止损和止盈在成交的瞬间根据实时 ATR 重新计算,确保风控参数始终适应当前的市场波动率。
风险提示
本脚本仅供教育和量化分析使用。回测或实盘的过往表现并不预示未来结果。加密货币交易具有极高的风险和波动性,请务必做好仓位管理,并自行承担使用本策略的风险。

New Age US ORB═════════════════════════════════════════════════════════════
NEW AGE US ORB
Opening Range Breakout Strategy with Neon Glow Effect
═════════════════════════════════════════════════════════════
🔒 INVITE-ONLY ACCESS
This script requires an invitation to use.
To request access, please send me a private message.
═════════════════════════════════════════════════════════════
🎯 OVERVIEW
The New Age US ORB is a clean, professional Opening Range Breakout (ORB) strategy with a futuristic visual style featuring dynamic neon glow effects.
Designed for Crypto (BTC/USD) and Indices (US100, US30, SPX) trading.
Best results on 5-minute or 15-minute chart with Regular Candles.
The strategy captures the first 15 minutes of US market activity (9:30-9:45 NY) and trades breakouts in the direction of the initial move.
💎 WHAT MAKES THIS UNIQUE
Unlike standard ORB indicators, this strategy combines:
• Proprietary 3-layer Neon Glow visualization for enhanced box visibility
• Integrated US Session backgrounds for market context
• Smart Session Filter to avoid low-probability late entries
• Separate Long/Short TP management for asymmetric markets
• Automatic EOD position closure for overnight risk control
• Daily trade limiter to prevent overtrading
• Global Timezone Support - works correctly for traders worldwide
This combination of visual design and risk management features is not available in standard ORB scripts.
Trade Smarter, not Harder.
📦 WHAT IS ORB?
The Opening Range Breakout (ORB) strategy is based on the concept that the first 15 minutes of the US market session often sets the tone for the rest of the day. The High and Low established during this period act as key support/resistance levels.
• Price breaks ABOVE ORB High → Bullish momentum (LONG)
• Price breaks BELOW ORB Low → Bearish momentum (SHORT)
⚡ KEY FEATURES
📦 ORB BOX VISUALIZATION
• Automatically captures High/Low of 9:30-9:45 NY candle
• Dynamic color change:
→ Cyan: Price ABOVE ORB High (Bullish)
→ Red: Price BELOW ORB Low (Bearish)
• Extends throughout the trading session
✨ NEON GLOW EFFECT
• 3-layer glow effect around the ORB box
• Layered borders (8px → 5px → 3px) with gradient transparency
• Creates futuristic, high-visibility appearance
• Toggle on/off in settings
🕐 US SESSION BACKGROUNDS
• US Open (9:30-11:30 NY) - Blue
• Lunch Break (11:30-13:30 NY) - Orange
• Afternoon (13:30-16:00 NY) - Green
• Visual reference only - helps identify optimal trading windows
⏱️ SESSION FILTER
• Configurable trading window (default: until 11:50 NY)
• Prevents late entries when momentum fades
• EOD auto-close in YOUR selected timezone (default: 21:45)
🎚️ RISK MANAGEMENT
• ORB Box Stop Loss: SL at opposite ORB level + buffer
• Separate Take Profit settings for Long/Short
• Points or Percentage mode
• Daily trade limit (default: 6 trades max)
📊 INFO DASHBOARD
• Real-time status panel (top right)
• Shows: Timezone, Status, Session, Direction, Trades, SL/TP, EOD, ORB levels
⚙️ SETTINGS
TIMEZONE
└── Your Timezone: Select from 12 global timezones (Default: Europe/Zurich)
Available: UTC, New York, Chicago, Los Angeles, London, Berlin,
Zurich, Paris, Tokyo, Hong Kong, Singapore, Sydney
ORB BOX (9:30-9:45 NY)
├── Show ORB Box: true/false
└── Neon Glow Effect: true/false
US SESSION BACKGROUNDS
├── Show Session Background: true/false
├── US Open Color (9:30-11:30)
├── Lunch Color (11:30-13:30)
└── Afternoon Color (13:30-16:00)
SESSION FILTER
├── Enable Session Filter: true/false
├── Session End Hour (NY): 0-23
└── Session End Minute (NY): 0-59
DAILY CLOSE (Your Timezone)
├── Enable Daily Close: true/false
├── EOD Hour: 0-23
└── EOD Minute: 0-59
TRADE LIMITS
├── Enable Daily Limit: true/false
└── Max Trades per Day: 1-10
STOP LOSS
├── Enable ORB Box SL: true/false
└── SL Buffer: Points distance from ORB level
TAKE PROFIT - LONG
├── Enable TP Long: true/false
├── Mode: Points / Percent
├── TP Long Points: Distance in points
└── TP Long Percent: Distance in %
TAKE PROFIT - SHORT
├── Enable TP Short: true/false
├── Mode: Points / Percent
├── TP Short Points: Distance in points
└── TP Short Percent: Distance in %
COLORS
├── Bullish: Default #00ffbb (Cyan)
└── Bearish: Default #ff1100 (Red)
📈 HOW TO USE
1. Apply to BTC/USD or US100 on 5min or 15min timeframe
2. Use Regular Candles for realistic results
3. Go to Strategy Properties → Enable ☑️ "Recalculate On Bar Close"
4. Select your Timezone in settings (for correct EOD close time)
5. Wait for ORB box to complete (9:45 NY)
6. Strategy enters automatically on breakout:
→ LONG when price closes above ORB High
→ SHORT when price closes below ORB Low
7. Manage risk with ORB Box SL and TP settings
8. All positions close at EOD time (in your timezone)
🔔 ALERTS
• LONG Entry - Breakout above ORB High
• SHORT Entry - Breakout below ORB Low
• EOD Close - End of day position close
💡 BEST PRACTICES
• Most effective during US Open session (9:30-11:30 NY)
• Avoid Lunch session (11:30-13:30) - lower volatility
• ORB levels act as support/resistance all day
• Wider TP for trending days, tighter for ranging markets
• Use session filter to avoid late, low-probability entries
═════════════════════════════════════════════════════════════
© AL_R4D1 - New Age Style Trading Tools
═════════════════════════════════════════════════════════════


SMC Pro [Stansbooth]
🔮 SMC × Fibonacci Confluence Engine — The Hidden Algorithm of the Markets
Welcome to a level of chart analysis where mathematics , market psychology , and institutional logic merge into one ultra-intelligent system.
This indicator decodes the true structure of price delivery by combining Smart Money Concepts with the timeless precision of Fibonacci ratios , revealing what retail traders can’t see — *the algorithmic heartbeat of the market*.
✨ What Makes This Indicator Different
Instead of drawing random lines or reacting to late signals, this tool **anticipates** market behavior by reading the footprints left behind by institutional algorithms. Every element is placed with purpose — every zone, every shift, every fib level — all forming a seamless narrative that explains *why* price moves the way it does.
🔥 Core Intelligence Features
Advanced BOS/CHOCH Auto-Detection — Spot structure shifts before momentum even forms.
Institutional Liquidity Mapping
— Identify liquidity pools, engineered sweeps, equal highs/lows, and trap zones designed by smart money.
Fibonacci-Aligned Precision Zones
— Auto-generated fib grids synced with SMC levels for pinpoint reversal and continuation setups.
Imbalance Engine
— FVGs, displacement, inefficiencies, and mitigation blocks displayed with crystal clarity.
Premium/Discount Algorithm
— Understand instantly whether price is in a zone of accumulation or distribution.
🚀 Designed for Traders Who Want an Edge
Whether you're scalping fast moves, capturing intraday swings, or holding higher-timeframe plays, this indicator provides a professional lens into the market. It turns complex price action into a structured, predictable system where every move has logic and every entry has confluence.
You don’t just see the chart —
you see the intention behind every push, pull, manipulation, and reversal.
💎 Why It Feels Like a Cheat Code
Because it mirrors the way institutions analyze the market:
— Identify liquidity
— Seek equilibrium
— Deliver price
— Create inefficiency
— Mitigate
— Continue the narrative
Using SMC and Fibonacci together unlocks the “algorithmic geometry” behind price movement, giving you clarity where others see chaos.
⚡ Trade With Confidence, Confluence & Control
This indicator isn’t just a tool.
It’s a complete trading framework — structured, intelligent, and deadly accurate.
Master the markets.
Decode the algorithm.
Trade like smart money .

NG RSIA trend-following trading strategy for Henry Hub natural gas futures on the Moscow Exchange (MOEX).

StrategyScript77 Is a rule-based strategy built on top of an Ichimoku based engine.
Ichimoku concepts are used as the backbone for trend and momentum filtering, so the strategy tends to stay on the side of the dominant move instead of fighting it.
The name “Super77” comes from the behavior I consistently observed in testing because the win rate tends to hover around the 70–80% range, often clustering around ~77% when used as intended.
It’s not a promise or guarantee, but it reflects the core design philosophy: frequent, relatively small but steady wins, with controlled and manageable losses.
Trading Style – Built for Conservative Traders
Super77 is intentionally designed for traders who prefer a conservative and calm approach:
Entries only at bar close
The strategy waits for bar close confirmation before entering a position. No intrabar guessing, no chasing half-formed signals. If the signal is still valid at close, only then will it enter.
Exits automated on bar close
Exits are also managed on bar close, which makes the logic transparent, easy to review on the chart, and more robust in backtesting compared to tick-based or intrabar hacks.
Semi-auto friendly
If you like to keep some discretion, you can treat it as semi-automatic:
Let the strategy generate entry signals
Manually cancel or skip certain trades if market context changes (news, extreme volatility, etc.)
This combination makes Super77 suitable for traders who don’t want to stare at the screen all day but still want structure and automation.
How to Use
Works best with bar-close execution (avoid trying to simulate intrabar fills if you want consistent behavior).
Designed for conservative, trend-aligned trading, not for hyper-scalping or news gambling.
Can be used as:
Fully automated (let all entries/exits trigger on bar close), or
Semi-automated (use alerts/signals but manually cancel some entries).
Step-by-Step: Automation with Cornix (Webhook Setup)
You can automate Super77 using Cornix by connecting TradingView alerts to your Cornix group via webhook.
Note: Exact button names may differ slightly depending on Cornix / TradingView updates, but the flow is always the same:
Cornix group → get webhook URL & mapping → TradingView alerts → signals sent to Cornix.
(Optional) Map specific pairs / directions
If you use UUID / signal mapping per symbol and per side (long/short), set them up in Cornix according to your own template.
Super77 can be used either:
On a single pair (simple setup), or
On multiple pairs if your alert / webhook structure supports that. So you can pick many pairs with 1 script.
Final Notes & Disclaimer
Super77 is an educational and experimental trading tool, not financial advice.
Past performance in back tests does not guarantee future results.
Always:
Test on demo or paper first
Adjust risk to match your own profile
Accept that losses and drawdowns are a natural part of any strategy
If you’re looking for a strategy that reflects a conservative, confirmation-based trading style with a focus on steady win rate and smoother equity behavior, Super77 was built exactly with that mindset in mind.

Hyper swing📌 Hyper Swing is a trend-based strategy that uses bands that change based on volatility to identify and execute directional breakouts.
This strategy includes adjustable strictness, intuitive visual trading area lines, and dynamic trend colors.
────────────────────────────
Trend Framework
─────────────────────────────
■ Core Trend Calculation
This strategy builds a trend model using:
EMA (Base): Short-term trend reference point.
EMA (Smoothing): Smooths the trend reference point further.
Volatility Band Threshold:
threshold = baseSensitivity × strictFactor × stdev(close, mainLen)
Using this threshold, we get:
Upper Band = Smoothing + Threshold
Lower Band = Smoothing - Threshold
These adaptive bands determine bullish and bearish breakouts.
■ Strictness System (1-10)
The higher the strictness level, the stronger the price breakout must be before it is considered a true signal.
Each level is mapped to a strictFactor, which controls volatility sensitivity.
Level Factor
1 0.8
2 1.0
3 1.2
4 1.5
5 1.8
6 2.0
7 2.2
8 2.5
9 2.8
10 3.0
Higher strictness results in fewer but stronger signals.
■ Trend Detection
Uptrend: Close > upperBand
Downtrend: Close < lowerBand
Trendline colors change dynamically.
Neutral: No graph color
──────────────────────────
Signal Generation
──────────────────────────
■ Trigger Conditions
Long Breakout: Crossover (Closing Price, Upper Band)
Short Analysis: Cross-Under (Closing Price, Lower Band)
■ Preventing Duplicate Signals
The status variable (lastSignal)
does not repeat consecutive long signals.
does not repeat consecutive short signals.
This prevents over-triggering in turbulent situations.
■ Purpose
Hyper Swing is designed to:
Capture strong momentum swings using statistically adapted breakout trading techniques.
Reduces noise through a multi-stage stringency filter.
Prevents duplicate signals in the same direction using a swap format.
This strategy does not predict future prices or guarantee profitability. It's simply a matter of applying systematic rules to breakout-based swing trading.
