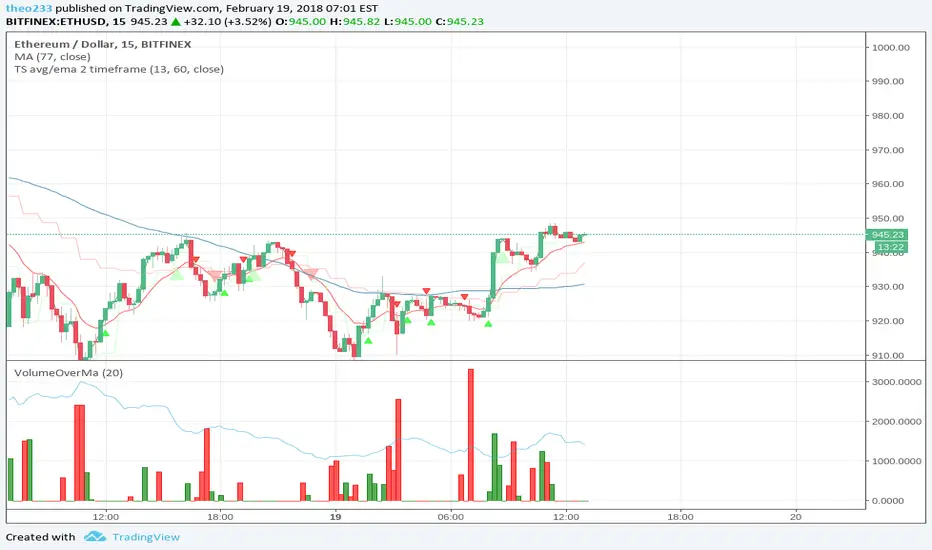
TS avg/ema 2 timeframeChart alerts of Cross between Average price and EMA on 2 timeframe
First timeframe comes from period
Second timeframe comes from input (default 1hour)
Timeframe
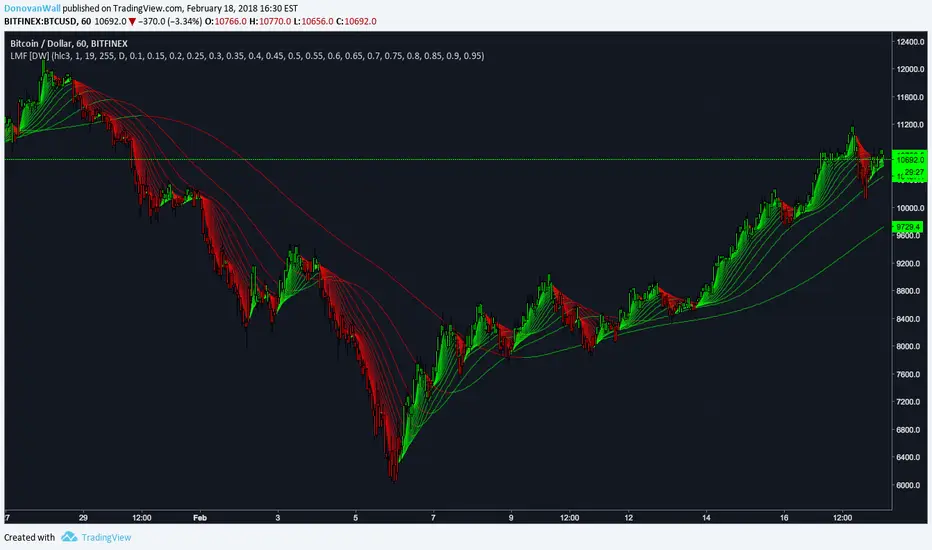
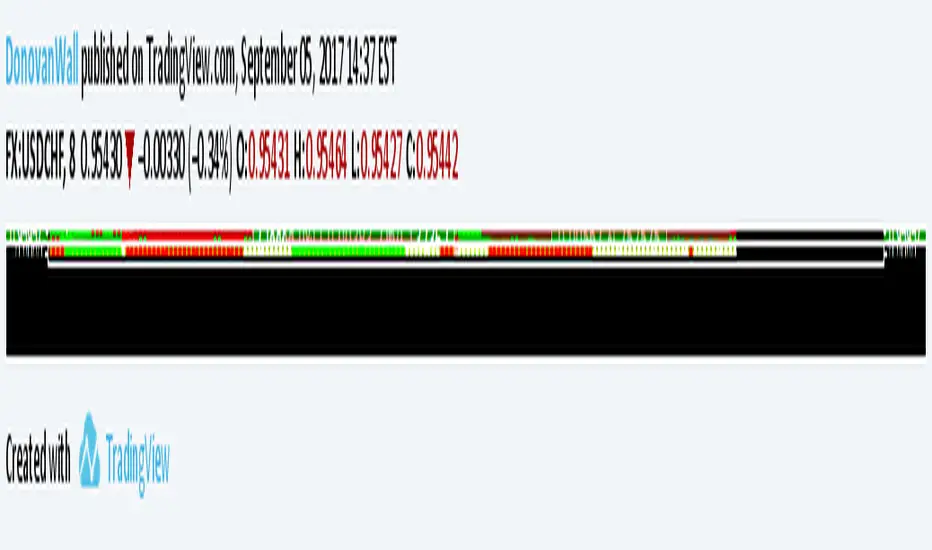
Laguerre Multi-Filter [DW]This is an experimental study designed to identify underlying price activity using a series of Laguerre Filters.
Two different modes are included within this script:
-Ribbon Mode - A ribbon of 18 Laguerre Filters with separate Gamma values is calculated.
-Band Mode - An average of the 18 filters generates the basis line. Then, Golden Mean ATR over the specified sampling period multiplied by 1 and 2 are added and subtracted to the basis line to generate the bands.
Multi-Timeframe functionality is included. You can choose any timeframe that TradingView supports as the basis resolution for the script.
Custom bar colors are included. Bar colors are based on the direction of any of the 18 filters, or the average filter's direction in Ribbon Mode. In Band Mode, the colors are based solely on the average filter's direction.
SuperTrend MultiTimeFrame with Alerts V.1SuperTrend Multi Time Frame with Multi Alerts ... you can insert alerts for all supertrend viewed on graph.
Different alerts for long and short.
This script plot 5min, 1H and 1D!
Enjoy!

MTF Polarity Grid [DW]This is an experimental study designed to track directional polarities across multiple timeframes and express them as a simple two color grid.
The polarity in this calculation is determined by divergence between a fast and slow McGinley Dynamic.
Your current resolution's polarity is the top row, the rows below are are for higher timeframes of your choice.

MTF Donchian Quadrants [DW]This is a simple Donchian Channel variation that separates the the channels into quadrants, and enables MTF calculation.
Average open and close plots are included for additional confirmation of a trend.

Hawkeye RoadkillWait for the Roadkill signal – then dive for the perfect kill!
Hawkeye Roadkill looks at multiple timeframes simultaneously, and then provides two entry signals, one based on the trend and the other on volume.
One of the biggest problems traders face is that whenever they see a signal or set up in one timeframe, they immediately look at a lower or higher timeframe chart to validate the signal for the confidence to enter the trade. This is a classic problem, and one that can be seen on virtually every trader’s screen, which can be cluttered with several charts, all with different timeframes and all giving different signals to the confused trader. Ultimately, the trader loses both money and confidence, and is no longer able to trade.
For example, if you are looking at a daily chart, does the weekly chart also suggest that your trade is valid? Or, if you are looking at a 15 minute timeframe, does the one-hour chart confirm your analysis? Often the two charts will differ in their signals, since a trend that has begun in one timeframe, may already be ending in another.
So you have two clear signals to get you into the market in your preferred timeframe.

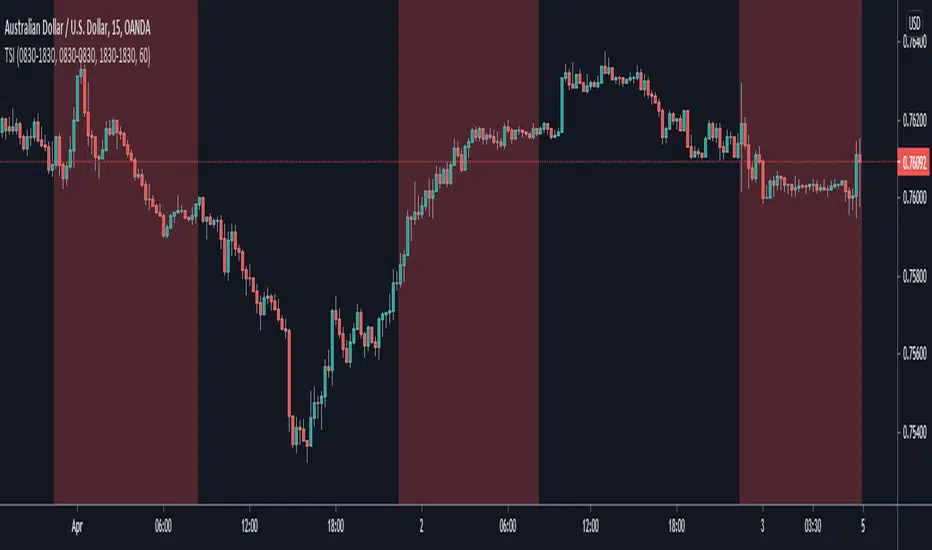
Trading Session IndicatorThis indicator is basically just a back-testing tool. All it does is highlight the background of your charts with the specified color within the specified timezone.
This is useful particularly for back-testing purposes, such as testing a day-trading strategy within a particular period of the day or ignoring signals that fall within the given timeframe (which is useful for ignoring setups during your testing that appear while you're asleep or at work etc.)
Take it easy :)
- Matt.
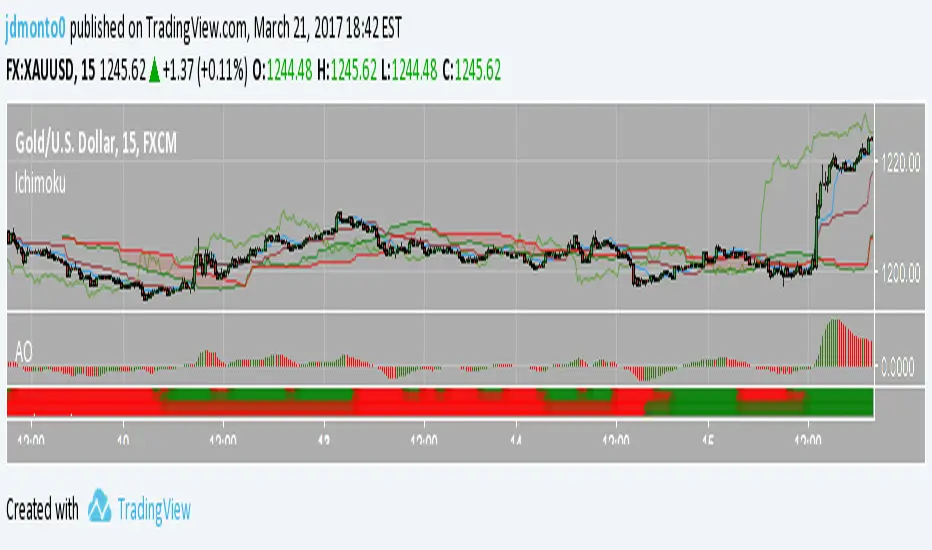
Multiple Ichimoku CloudsFor anyone that uses the Ichimoku Cloud there is a consistent need to flip between timeframes to get information about this at all levels. However, that trouble is now over. In this script there are 4 Ichimoku Clouds that operate in 4 different time frames. To change the timeframe simply change the multiplication factor to the desired levels. How this script works is that it takes your current timeframe as an input then it applies multiplication factors to it to achieve larger timescales. In the example here we are looking at the XBTJPY pair on the 1 hour. Our first cloud is 1x scaling, meaning that it is the 1 hour cloud. The second and third are 2x and 4x respectively meaning that we are looking at the 2 hour cloud and the 4 hour cloud. Lastly the largest cloud is the 24x cloud, aka the daily cloud. Now you only really need one look at the clouds for all the essential information.
As always feel free to message me about anything regarding this script.
Be happy :)
4 Time Frame Two EMAs Ribbon Comparison - Tom1traderI had seen something like this on metatrader but not here. Since I use TradingView and not metatrader had some fun with this. Indicates up or down for 4 chosen time Frames and as such helps to see the historical trend. Works best on daily or shorter charts because of load time.
User can choose the length of the two exponential moving averages used on each time frame or use defaults 9 and 15.
User can choose the 4 time frames defaults are (display from top to bottom) 5, 15, 60 and D.
Displays a column of 4 dots or circles for each bar of current chart the top being the shortest time frame.
If the faster exponential moving average is above the slower (uptrend) the dot is green else red.
This is similar (actually what I was originally shooting for but took extra time to figure out time frames on here) to another script of mine that has the same display method but uses a spaced set of Hull Moving Averages on one time frame, you choose the shortest length and the space increment between the averages. One may work better than the other for different markets or trading styles. The other one is here: Have fun trading and keep smiling!

MTF Previous Open/Close/RangeThis indicator will simply plot on your chart the Daily/Weekly/Monthly previous candle levels.
The "Auto" mode will allow automatic adjustment of timeframe displayed according to your chart.
Otherwise you can select manually.
Indicator plots the open/close and colors the high-low range area in the background.
Hope this simple indicator will help you !
You can check my indicators via my TradingView's Profile : @PRO_Indicators

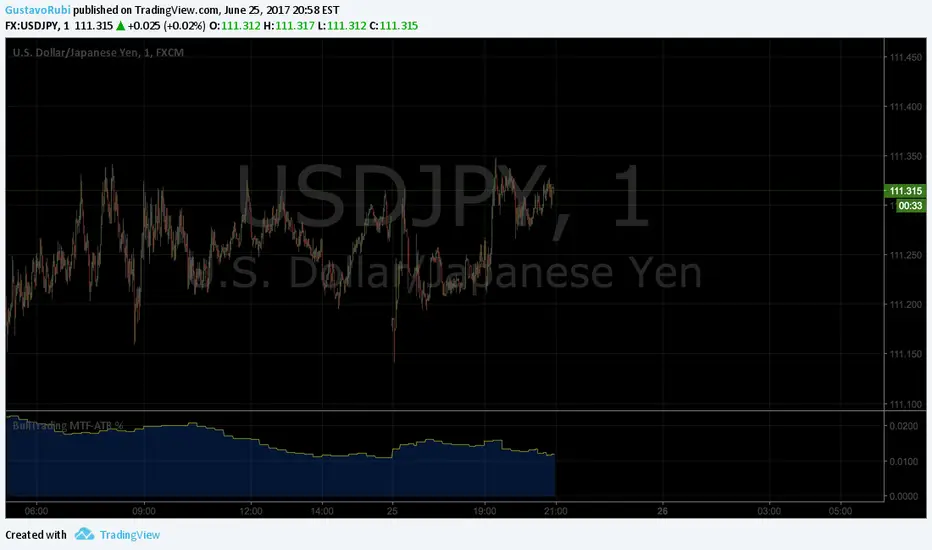
BullTrading MultiTimeFrame ATR %Good afternoon traders.
Have you ever got trapped on the middle of a consolidation? Well, it just happened to me trading the 1 minute chart last friday!
So, I coded this script to display a percentage of ATR for a given resolution.
Now, how can you benefit using this information?
For example:
Using the standard settings (resolution is calibrated 15 minutes in order to trade 1minute charts), just draw your prefered support and resistance. Then measure the number of pips between support and resistance. This number should be approximately the same the indicator is displaying. If the indicator is displaying a lower value, maybe it will be a good idea to tighten your support/resistance levels (if the price goes against you, you will have confidence and probability on your side to open an opposite position and reach your Take profit before a new reversal take place.
Change colors and resolution for your desired timeframe until you find your particular "sweet spot"
Have a nice trading week.
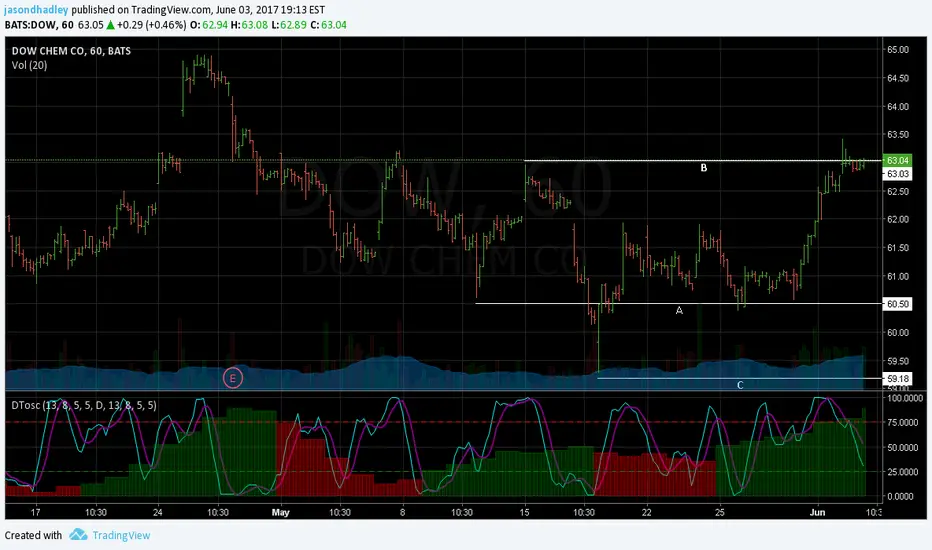
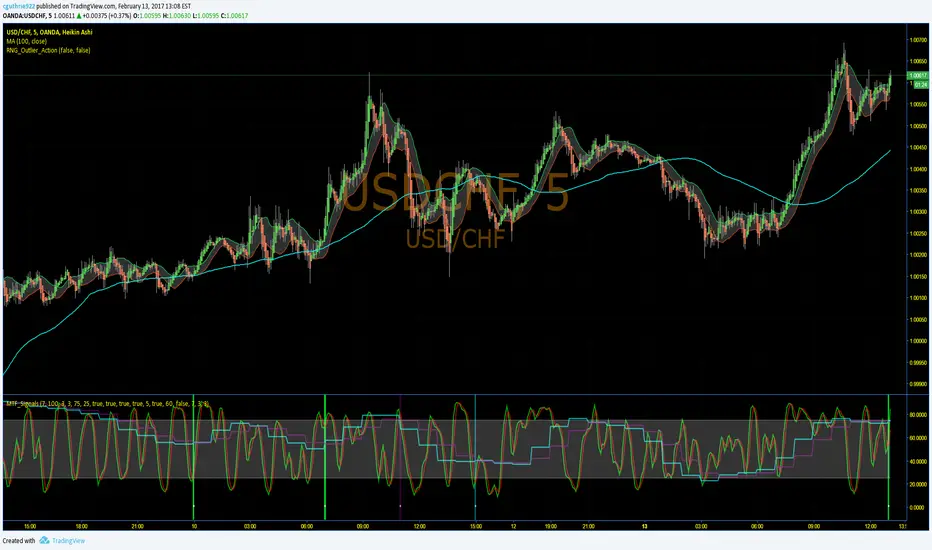
Dynamic Time Oscillator W/ MTF SupportThis script has the option to disable the MTF feature and use it as a plain DTOscillator.
The lines are the fast and slow signals for the current timeframe.
The columns are the second timeframe %K levels.
Green columns signify the second timeframe %K is greater than the second timeframe %D, Red is the reverse of this.
MTF Trend 4 in 1 multi time frame consistence check indicatorPrice can be up trend and downtrend simultaneously in different timeframes.
Experienced traders know the importance of looking at Multiple Time Frames.
Analyzing multi time frame chart allows trader to have a greater view on the price action.
This MTF trend indicator shows the trend of current time frame and 3 higher time frames in a single chart. In addition, it will check the consistence of all 4 time frames. It will not repaint.
It will only work on time based charts. Tick and range charts are not supported.
The green dots represent uptrend, and the red dots represent downtrend.
The 'trend period' is used to measure the direction of price within the given number of bars.
The dots of value 1 at the bottom is the trend of 'timeframe 1'
The dots of value 2 is the trend of 'timeframe 2'
The dots of value 3 is the trend of 'timeframe 3'
The dots of value 4 is the trend of current timeframe.
If current and 3 higher time frames are in the same direction, the dots at the top will appear.
Otherwise, there will be no dots at value 6.
'timeframe1' 'timeframe2' and 'timeframe3' must be higher than current timeframe, if your chart is 15min, then 'timeframe1' 'timeframe2' and 'timeframe3' must be 15min or higher.
It will highlight bars when trends are inconsistent in different timeframes.
You can change the highlight color, or disable this feature.
The highlighted bars represent the situation where price may change its direction from previous trend, or in a short-term adjustment.

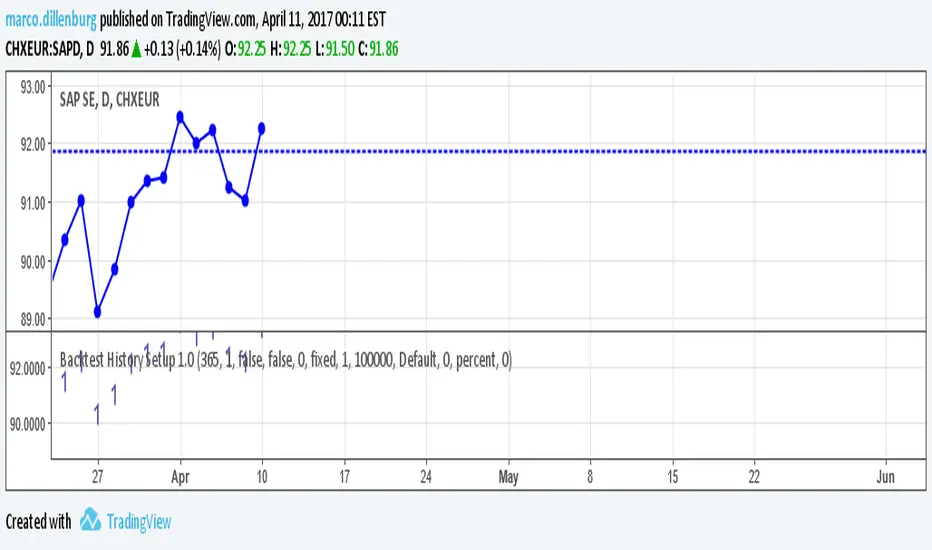
Backtest History Setup 1.0Script of strategy component to setup the backtext lookback. You setup the maximum days back in the history, which will be used for backtest.
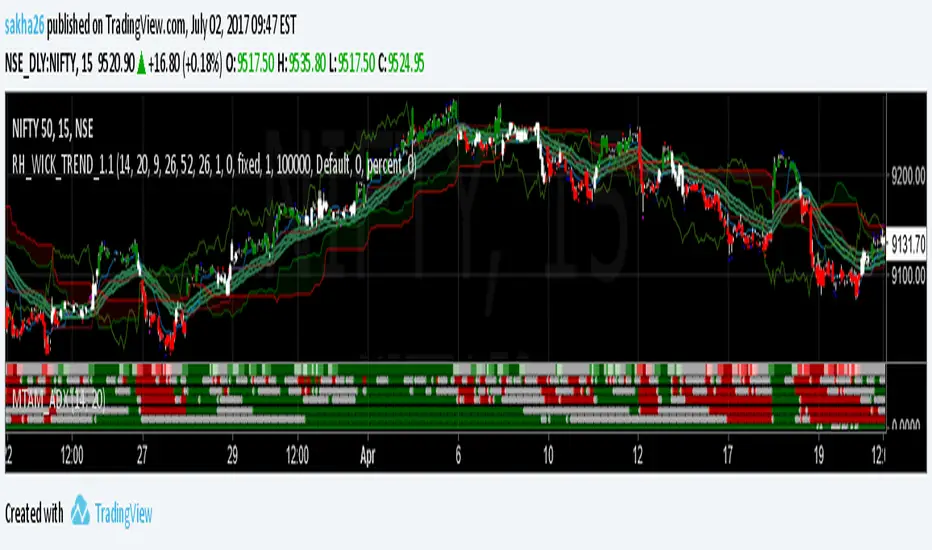
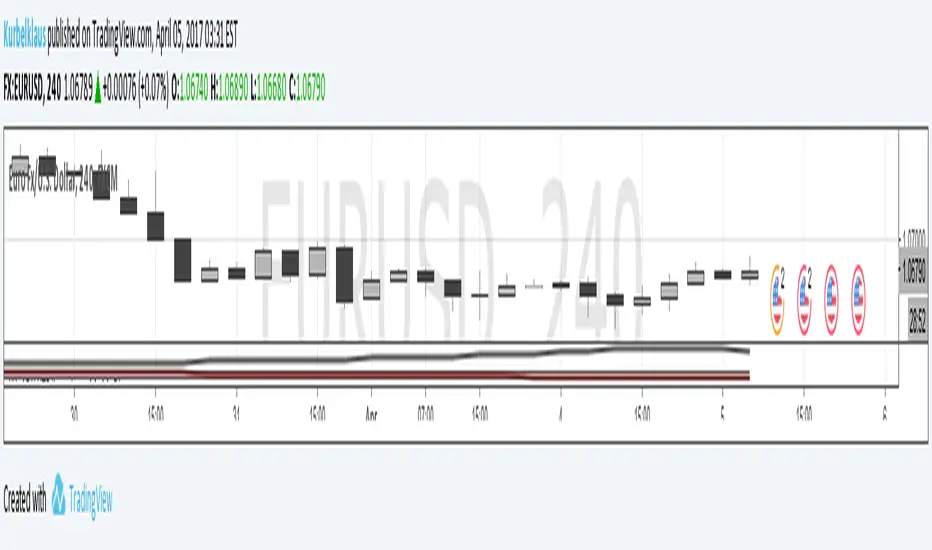
KK_Average Directional Index (ADX) Higher TFHey guys,
sometimes you just want to plot an Indicator value from a higher Timeframe on your Chart. For most Indicators this is pretty straightforward however there is one Indicator that has been giving me quite a headache while trying to do this: The Average Directional Index . Anyway after going through almost 200 versions of this script I finally found a solution that works and thought I would share this with you, since I'm sure some of you have encountered the same problem.
How it works
Go to your desired Instrument/Timeframe and add the Script
Under Settings in the field for "Higher ADX TF" put the Timeframe-code you want to pull the ADX Values from.
- Codes: Monthly - M, Weekly W, Daily - D
- Codes Intraday: The amount of hours in minutes, e.g. if you want to pull values from the 4h-Chart the code is 240 (60 for 1h, 15 for 15m ...)
In some cases (see below) the calculation might not be correct. So make sure the values are correct:
a) Write down the latest ADX of the higher TF while you are on the lower TF
b) Switch the Resolution to the higher TF
c) Compare the value you have just written down to the next to last value. They should be the same.
d) Switch back the Resolution to the lower TF and you're good to go.
Limitations
You can only pull values from higher Timeframes, e.g. you're on a 4h Chart, so you can only pull values from the Daily, Weekly and Monthly Chart. You can't pull values from the 1h Chart.
You can only pull values from Timeframes, where the higher Timeframe Close always has a corresponding Close on the lower Timeframe, e.g. you can't pull values from the 3h Chart when you are on a 2h Chart. This should be pretty rare.
The Script needs a certain amount of Data from the Higher TF before the calculated values are correct. I have tested this on several Instruments and the Script usually needs approximately 100 Bars on the higher Timeframe (often less) for the values to be correct (error < 1%).
So when the difference between your lower Timeframe and you higher Timeframe is large, e.g. you want to pull the Daily ADX value on a 15m-Chart, the calculation can be wrong. This can lead to errors in 2 Cases:
a) Backtesting: When you go over old data and get close to the last available Bar the Data will be wrong. This will limit the amount of data you can backtest.
b) Live values: When the difference between the two Timeframes is too large, it is possible that even live values are wrong, e.g. this will be the case when you are trying to pull the Daily ADX value on a 5 minute Chart. Always check if the calculation works with your desired combination of Timeframes before using it (see above).
I hope this is useful for you and whish all of you successful trading!
Best regards
Kurbelklaus
Fractal Composite Ribbon V2.1Added alerts when L1 fast or L2 med-fast pop out of grey hysteresis state into red or green. These new alerts do not require being in shaded overbought/oversold zones so they're better for catching continuation moves. Thanks to fbatistat for the suggestion.
Also exposed the "Cross Hysteresis" parameter for the width of ambiguous grey "slack" before lead lines push into red or green.

MTF_Stochastic_SignalThis script sets up signals based on Multi-timeframe (MTF) stochastics. Alerts can easily be created to inform users of aggressive and conservative potential BUY and SELL opportunities. Overbought and oversold levels do not matter when it comes to signalling, but each trader can set their own limits.
DEFAULT CRITERION
Conservative BUY criteria is when both stochastic timeframes cross upward at the same time the closing price is above the simple moving average.
Conservative SELL criteria is when both stochastic timeframes cross downward at the same time the closing price is below the simple moving average.
Aggressive BUY criteria is when both stochastic timeframes cross upward at the same time.
Aggressive SELL criteria is when both stochastic timeframes cross downward at the same time.
TO SET UP ALERTS
1. In the "Create Alert" menu, select the "MTF_Stochastic_Signal" as the Condition.
2. To the right of the condition select one of the options that has "greater than 1" at the end of it.
3. Instead of the word crossing in the dropdown below, select "Greater Than"
4. For the value, input 1. (My TRUE values are set to 50 in the event you want to turn the plot on, however, this is not neccessary as it is redundant)
5. Select the remaining options that suit your needs and click "Create". You have now set up alerts. I suggest setting all four options fo reach symbol you monitor.
Please feel free to ask questions and provide comments. I am always looking for ways to improve my scripts.
Enjoy!
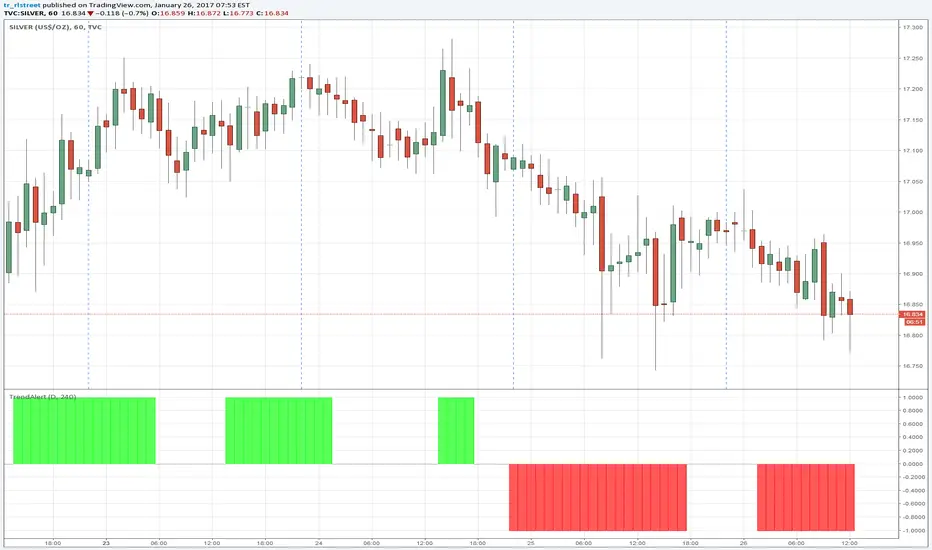
TrendAlertTrend Alert indicator based on Long term (daily) en Mid term (4h) timeframes so you can enter a trade in direction of the trend at the Short term (1h) timeframe in direction of trend. You can configure the LongTerm en MidTerm timeframe to your liking. Method by Jospeh Nemeth www.youtube.com
Trading Sessions v.2 - Max WarrenUpdated to work with Pine updates:
London DST timezone still broken. Will fix later.
As always full customization visually, with London fix I'll add more options.
Keep in mind the render resolution option

Dynamic Support/Resistance Zones Multi-ResSimple support and resistance areas. The threshold parameter determines the sensibility. It works better if volume data is good.
Remember to refresh the script once in awhile when applied to lower resolutions.
//std1243cf0
